Mounting image with python-guestfs

Automating a sandbox: Evidence Collection

20,000 Leagues Under The Sand: Part 5

read part 4

You may have a tricked-out sandbox that logs host activity, does packet capture and IDS, and will make you a slice of toast, but none of the bells and whistles will do you any good without collecting the information and putting it in front of your eyes. The techniques required will test your knowledge of network and file system forensics, as well as your skill with code. Let’s start with an easy one.

Suricata logs

If you have followed the suggestions made earlier in this series, Suricata will be writing events to files in /var/log/suricata/ in JSON form, one object per line. This lends itself to ease of use; pretty much any language will have a good JSON parsing library. All you will need to do is filter for entries based on the timestamp being within the period you were running your malware sample.

Be aware that the Suricata log does not get truncated unless you have specified. If you read and filter the log using  the simplest method (line-by-line read from the start, parsing each event then filtering), this will eventually become very slow. You should consider rotating the file, either yourself or using Suricata’s built in rotation, and make sure that your parsing and filtering takes account of this rotation.
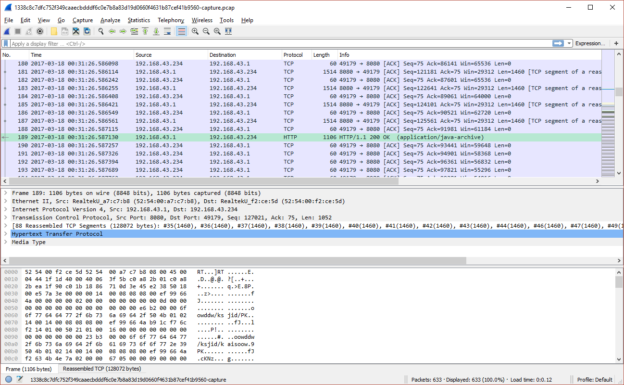
Packet capture

As mentioned in the post discussing networking, you can either create a per-run packet capture as part of your code (assuming your language has the appropriate libraries), or a systemwide one which you can then extract portions of.

If you only ever plan to have one guest VM sandboxing malware at a time, the per-run capture should be fine and relatively simple. If you are slightly nuts ambitious like me and want to design for the possibility of several in parallel, a systemwide capture would be more suitable. Again, depending on the way you have organised capture, you should make sure your code accounts for the rotation of the pcaps.

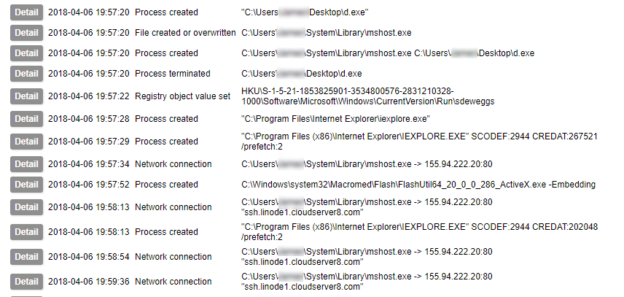
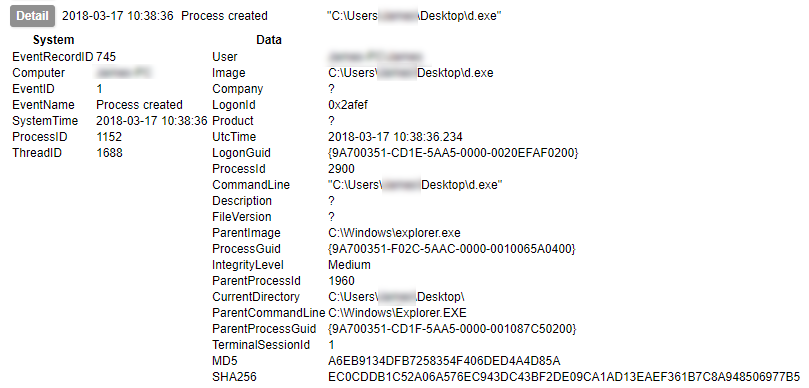
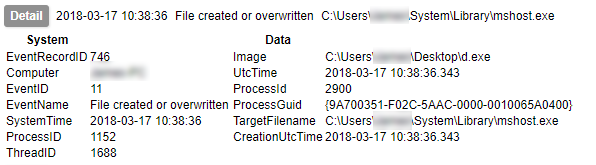
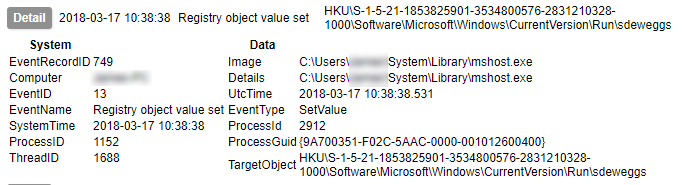
Host activity/event logs

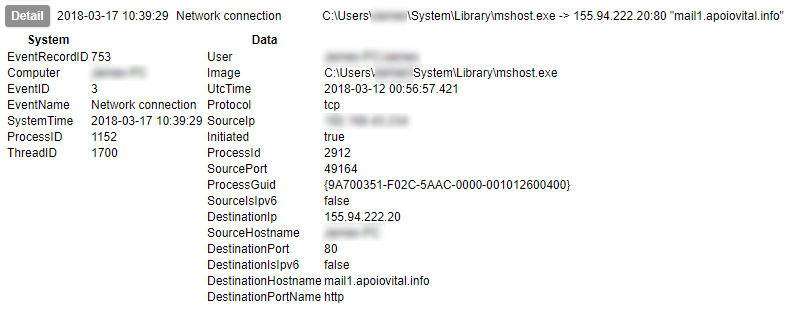
Early on in this series I waxed lyrical about the advantages of Sysmon. I am not going to contradict any of that here, but collecting its output is not as simple as you might think. Windows event logs get written to EVTX files, but not necessarily immediately. Therefore although an event may be generated, its presence in the EVTX file is not guaranteed. Under testing I have found that not even a shutdown is a guarantee of the events being written to the file. The only method I have found to be 100% reliable is to query the Windows Event Log API¹. Therefore, to collect Sysmon logs in a reliable fashion, you need to be able to use the Windows API.

I am aware of two methods for doing this. The first is to write a program which queries the API, and run that in your sandbox. You can then write the data to a file, or send it out of the sandbox immediately. To send it out of the sandbox you could have a service on the host listening on the virtual network interface, such as an FTP or HTTP server.

The second method would be to use Windows Event Forwarding. This is a tremendously useful technique for blue teamers and comes highly recommended by Microsoft staff. It does, however, require you to have a second Windows host on which to collect the events, which may not be an option for you. Most documentation you will find on this will refer to setting it up in an Active Directory environment, however it is also capable of running in workgroup-only systems.

¹ I strongly suspect that the events are being written to temporary files but at the time of writing this is little better than a hunch. I’ll chase down my suspicion at some point and if it’s right there’ll be a new post about my findings.

Filesystem collection

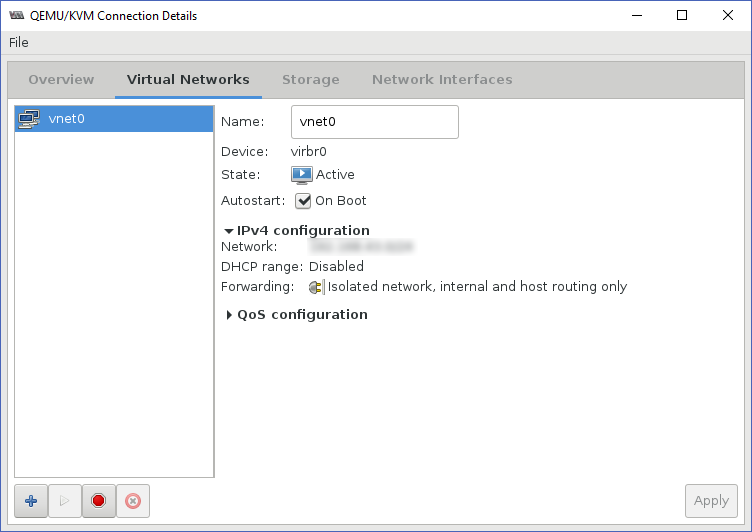
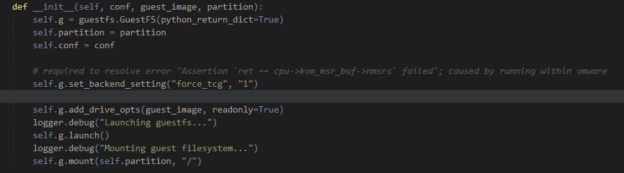
Getting events is a huge win, and might well be all you need; but why not go one step further? Malware drops and modifies files and writes to the registry, and if you could get your hands on that evidence, it could be invaluable. Another of the reasons for choosing LibVirt/QEMU as my hypervisor was the availability of python bindings for LibGuestFS, allowing me to directly mount and read QEMU disk images. However, you should still be fine with other hypervisors: VMWare also provides a utility for this, and VirtualBox can apparently be mounted as a… network block device? Please can I have some of whatever Oracle have been smoking, because it’s clearly the good shit.

Detailed coverage of the options for filesystem evidence collection could run to several blog posts of its own, so I won’t go into everything here. However, I will describe three approaches, each with their own advantages and drawbacks.

  • Diffing from a known-good state

The slowest, but most comprehensive method. Requires building a comprehensive catalogue of the hashes of all files on the disk prior to malware execution, and another one after, and identifying the differences. Not recommended unless you are truly desperate to roast your CPU with hash calculations.

  • Metatadata-based selection

Since you know the lower and upper time bounds for possible activity by the malicious sample, you can walk the directory tree and select only items which have been changed or created in that period. Relatively quick, but some malware is known to modify the MFT record with false created/modified values, known as ‘timestomping’.

  • Key items and locations

The majority of malware activity is limited to just a few locations. Taking a copy of the user directory, and SYSTEM and SOFTWARE registry hives, plus a couple of other items, would capture the traces left by most samples you might ever run.

There is a final option for collection of file-based evidence, and that is to use a host agent which collects the files as the malware writes them. The above methods would fail to capture a file that has been created and subsequently removed. In an earlier post I mentioned that if you were so inclined, you could write code which would monitor API calls yourself. Doing this would also give you the ability to capture temporary files in addition to the ones which are left behind.

Hopefully you now have an idea of the approaches you can use to gather useful information from the execution of a malware sample without the need for manual intervention. The final post in my series considers anti-analysis techniques and countering sandbox evasion.

Automating a sandbox: Guest VM control

20,000 Leagues Under The Sand, part 4

read part 3

When running malware in a virtual machine sandbox, proper management of the VM is imperative to prevent (unwanted!) contamination. You may already know that it is good practice to establish a clean state with a snapshot prior to running a potential nasty, so that you can simply restore it to get back to a known good state. It’s generally pretty intuitive to do this in a hypervisor’s GUI. It’s also pretty obvious how to run the malware you’re interested in – double click and hey presto, malware happens. But what do you do if you want all that to take place without you in the driving seat?

Hypervisor APIs

There are three core elements to automating a sandbox:

  • Controlling the guest VM’s state
  • Interacting with the guest
  • Capturing information from the guest

Fortunately, automating virtual machines is a requirement for far more than just the niche world of malware analysts. For nearly every function you could imagine, there is a means of controlling it with code instead of a GUI. You may have already noted that for my sandbox I chose QEMU/LibVirt, and one of the core reasons was the extensive resources for controlling it in the language I am most comfortable with, Python. If you are more partial to other languages, you can also choose from C, C++, C#, Go, Java, OCaml, Perl, PHP and Ruby.

Other hypervisors also have decent APIs; VirtualBox supports C++, SOAP (yuck), Java, and Python. Hyper-V is (naturally) controlled with Powershell. And so on and so forth.

Hypervisor APIs are primarily designed around the first of the three core elements (control), though there are some aspects for interaction and information capture available also. So to begin with the VM state, let us consider what control we might need. Since we want to make sure our results are relevant to the particular malware we have selected, we must be able to place the VM into a clean state. It is also sensible to only have the VM active when we are actually using it, so pausing/unpausing is also desirable (a cold boot might work, but you would either have to devise a means of logging in, or configure the VM for automatic login; plus it wastes time). These options are both possible through the LibVirt APIs.

Guest interaction

Two items involving guest interaction are essential to automate the testing of malware:

  • Deliver the sample to the guest
  • Execute the sample

You must transfer the sample to the guest’s file system. This can either be done from the host, or from the guest. It is theoretically possible to write directly to the filesystem, though this is strongly advised against for running VMs as it can cause corruption. Exposing a share with write permissions to the host is another option. The reverse can be done from host to guest (also not recommended). In my case I have chosen to cause the guest to download the file from a HTTP server exposed on the host’s virtual network interface. This is done with a small service running on the guest¹.

Running the sample can be done in a few ways. One that I experimented with was via a command:

cmd /c start C:\Users\<user>\Desktop\malware.exe

This should cause the file to be started with its default program and parameters. However, my results with this method were extremely unreliable, particularly with Java .jar files. It may have been possible to find out what was breaking things and fix it, but after a few weeks I was just tired of it and decided to try something else. What I wanted instead was for something that I could guarantee would work without fail. Enter VNC.

VNC is a protocol for remotely interacting with the graphical interface of a system. LibVirt comes with VNC as one of the options for interacting with guests; and handily there is a python library with which you can control VNC. Using this allowed me to send mouse movements and clicks, launching the file just as a user would. I should note here that the default protocol for interacting in LibVirt, Spice, is also capable of automation with python; however all of the resources I was finding when starting out helped me to get VNC working and I have not investigated the alternative at this point.

What we are doing here is not just executing the malware – we are simulating a user interacting with the system. This is important, because there is plenty of malware around that pays attention to what the user input is doing and will decide not to play ball if, for example, the mouse is not moving. I have also seen examples in which the malware will check for noticeable changes in the display and hide if it does not change – so just clicking empty bits of desktop is not going to help. Other samples might only become active if you visit the website of a bank (or any site the author is interested in – but mainly I have heard this in relation to banking malware). Capturing the activity of malware that does these things make simulating a variety of actions important.

Python code to interact with VM using VNC

VNC interaction in python

When simulating activity it is important to be aware of the limitations. If you are driving a sandbox, looking at a screen, you can react to what you see and adapt your actions. If a program has not finished running or a website has not loaded, you know to wait. You know what part of the screen is a login button for you to click, you know if there is a pop-up message that you have to approve or deny before progressing.  A script controlling a VNC mouse and keyboard – unless you do some extraordinarily ambitious work with image recognition – has no concept of these things; you must carefully tailor and test your scripted actions to take account of them. Even having considered these things, my sandbox sometimes has problems; I believe some of the time this is down to hardware resource limitations – although I have programmed pauses at moments I expect something to be loading, if something else on my host decides it needs CPU time and slows everything down, the pause I’ve created might not be enough. This is just one of the possible reasons but hopefully it illustrates that the issues can strike from unexpected directions.

I hope this has been informative; the next post discusses automatic collection of artifacts and evidence from the malware you have just executed.

Sandbox networking, packet capture, and IDS

20,000 Leagues Under The Sand: part 3

read part 2

Just as important to a sandbox as identifying actions the malware took on the host is observing its behaviour on the network. These days malware is almost guaranteed to have network activity; understanding how a sample is communicating is often all that is needed to tell you what the malware is.

When setting up a sandbox, careful thought needs to be given to your networking setup. Most malware is concerned only with reaching its command and control (C2) servers, but in the past year multiple malware families have seen lateral movement capabilities added, helped in no small part by the release of the EternalBlue SMB exploit. Under no circumstances should traffic from your sandbox VMs have unrestricted access to your network. Fortunately, most hypervisors’ default options make it simpler to do it safely than not – just be aware of the potential.

Additionally you should consider attribution and evasion; malware authors police the origins of connections and are known to blacklist the addresses of AV vendors, security researchers, and tor. If you would rather not have your IP on one of these lists you should think about how you can control the way malware traffic exits your network. Possibly the safest way is to route your traffic out through a consumer ISP that dynamically assigns IP addresses – so you might not need to do anything, as a large proportion of ISPs use this as their default. If you have static addressing and can’t afford a second line to your property, you might be able to set this up with a 4G router and data plan. At the minute, my sandbox is routing via tor as I do not have the option of a dynamic IP without spending more money, and I would prefer to risk some malware not functioning over advertising my IPs.

Whichever way you route your traffic, it is pretty simple to capture the output and perform intrusion detection when using qemu/Libvirt. In order to route traffic from VMs, it is necessary to create a virtual network interface.

Libvirt network configuration

Libvirt network configuration

This interface will be added to your system’s available network interfaces and is valid for use with tcpdump, Suricata, etc. N.B. when listing IPs/interfaces with ‘ip addr’ you will see the virtual bridge interface and virtual network listed separately, and the IP/subnet you have assigned will be defined on the bridge interface (named virbr0 or similar). Be careful about your choice of which interface to capture on; there are potential pitfalls for each. 

Firstly, the virtual bridge interface. When initially creating this post I encountered an issue with capturing at the virbr0 in which inbound packets for a TCP session had the correct source/destination IPs, but outbound packets showed the destination as being the gateway IP for the virtual network. As a result Suricata, Wireshark, and other tools could not reassemble the sessions correctly. I never identified precisely why this was so; unfortunately this means I cannot provide any specific advice for avoiding or fixing it other than to say it was probably related to the packet-rewriting rules being used to redirect traffic to tor.

I then switched to capturing on the virtual network, vnet0. This solved the problem of the inbound/outbound mismatches, however a capture (or Suricata inspection) on this interface will cease to function when there are no active attached hosts and will not start again unless the capture/IDS process is restarted. Thus if you are running a single VM as I have been and it reboots, your pcap and IDS processes will exit prematurely and will not resume when the VM does.

1: lo: <LOOPBACK,UP,LOWER_UP> mtu 65536 qdisc noqueue state UNKNOWN group default qlen 1
 link/loopback 00:00:00:00:00:00 brd 00:00:00:00:00:00
 inet 127.0.0.1/8 scope host lo
 valid_lft forever preferred_lft forever
 inet6 ::1/128 scope host
 valid_lft forever preferred_lft forever
2: ens192: <BROADCAST,MULTICAST,UP,LOWER_UP> mtu 1500 qdisc mq state UP group default qlen 1000
 link/ether 00:0c:29:3b:c7:47 brd ff:ff:ff:ff:ff:ff
 inet 10.0.0.4/24 brd 10.0.0.255 scope global ens192
 valid_lft forever preferred_lft forever
 inet6 fe80::20c:29ff:fe3b:c747/64 scope link
 valid_lft forever preferred_lft forever
3: virbr0: <BROADCAST,MULTICAST,UP,LOWER_UP> mtu 1500 qdisc noqueue state UP group default qlen 1000
 link/ether 52:54:00:ba:65:0e brd ff:ff:ff:ff:ff:ff
 inet 10.0.3.1/24 brd 10.0.3.255 scope global virbr0
 valid_lft forever preferred_lft forever
4: virbr0-nic: <BROADCAST,MULTICAST> mtu 1500 qdisc pfifo_fast master virbr0 state DOWN group default qlen 1000
 link/ether 52:54:00:ba:65:0e brd ff:ff:ff:ff:ff:ff
28: vnet0: <BROADCAST,MULTICAST,UP,LOWER_UP> mtu 1500 qdisc pfifo_fast master virbr0 state UNKNOWN group default qlen 1000
 link/ether fe:54:00:51:49:d6 brd ff:ff:ff:ff:ff:ff
 inet6 fe80::fc54:ff:fe51:49d6/64 scope link
 valid_lft forever preferred_lft forever

■ breaks when VM is shut down or restarted
■ may encounter issues with packet rewriting/tcp reassembly

Once the networking is set up, you can then deploy IDS to monitor it. There are two choices to consider, Snort and Suricata, and of these, the latter is so simple to get running that I’m largely mentioning the other to be charitable. Since versions and options change every few months I am not going to lay out a configuration; it would probably be obsolete by the time you read this. I will however highlight a couple of options in the current version (4.0.4 at the time of writing) of Suricata that deserve special mention.

eve-log: This is a catch-all log which can be configured to contain many different event types. Suricata can log metadata for many different protocols and situations including HTTP, DNS, TLS certificates, transferred files (e.g. HTTP downloads) including hashes, SMTP, and more. Almost all of this information is potentially useful in the context of a sandbox. While it is possible to spin off separate logs for each of these items, the JSON structure of the output makes it easy to parse and having them all together is convenient. Suricata supports rotating this log, naming according to a timestamp pattern, and setting custom permissions, all of which can be very handy.

rule-files: These are your detections, choose them wisely. The biggest bang for your buck is in the Emerging Threats community ruleset (free!), but not all of them will be applicable to a sandbox.  You should consider disabling ones which are irrelevant; for example, ‘inappropriate’, ‘icmp’, ‘mobile_malware’, ‘games’, and ‘scada’ are unlikely to be applicable.

Similarly your packet capture should be done on the virtual network interface and not the bridge. For capturing packets there are a wealth of options, of which I have tried a number. Here are some of the highlights:

tcpdump: the obvious first choice as it’s what everyone’s used to, but for a permanent capture service, not the best one. Will output to a single specified file until cancelled and restarted with a different destination, meaning that the process of managing the output is entirely down to you.

scapy: this was my choice for a long time due to it being possible to control from within python. However, if you are running more than one sandbox VM and want simultaneous capture of traffic from multiple sources, this is not an efficient choice.

pyshark/tshark: another python library, and the underlying tool called by pyshark; the latter efficiently captures everything, and unlike TCPdump, has the ability to manage rotation of capture files itself.

dumpcap: the base utility underlying tshark’s packet capture. tshark is possibly overkill as it is capable of far more than simply capturing packets. This is the method I am using at the time of writing.

For example, an hourly cron script as follows should create 24 one-hour pcap files, overwritten each day:

HOUR=`date -u +'%H'`
dumpcap -i vnet0 -a duration:3600 -q -w /usr/local/unsafehex/antfarm/pcaps/$HOUR.pcap -f "<your filters here>"

Note the -u flag passed to date; when trying to make sense of events and logs, it is crucial to ensure that your time information lines up. The simplest way to do this is to log everything in UTC; if desired you can convert to local time when presenting the information to the user. Also, use the main crontab as cron.hourly entries don’t necessarily run on the hour mark and it is important for this concept that each file matches the hour span that it is named for.

As well as capturing the output and running IDS signatures against it, you may want to consider performing SSL interception. This is a complicated topic and I have not mastered it, so I will not attempt to offer complete instructions at this point. However I will give a few pointers based on what I know so far. The simplest means of performing SSL interception for you is likely to be the squid proxy and its ssl_bump feature. This can be done as an explicit proxy (you will need to configure your client) or as a transparent proxy. In either case you will need to install the certificate you have made into the client as a trusted root.

SSL intercept does not play nicely with tor. It may be possible to still get it working with some routing/iptables magic, but the normal choice for routing squid through tor of using priovxy as a parent will not workEven if you do get your traffic routed through a proxy to tor, beware of DNS leakage. Using privoxy as the parent combats this; if you bypass this stage you will need to come up with a new solution for preventing DNS leak. I plan to integrate SSL intercept but only once I have the option of a dynamic IP.

There are other tools that you might consider using with your network traffic inspection, such as the metadata-logging framework Bro; however with recent updates, Suricata’s metadata capture is so powerful that it’s unlikely you’ll need anything else.

In the next post I discuss automating the delivery and execution of malware to the guest VM, and simulating user interaction.

Host activity monitoring

20,000 Leagues Under The Sand – Part 2

read part 1

As a newbie sandboxer, the biggest obstacle for me was finding a way of getting in-depth information on what actions were being performed by malware I wanted to test. In particular, I wanted to be able to drop some samples, go away and make lunch, then come back and be looking at some results. That meant stepping through it in a debugger was out, or at least a lesson for another day. You’ve probably already seen that I ended up using Sysmon, but let’s have a look at the alternatives for a moment.

Built in Windows logging

Filesystem forensics

  • The files in C:\Windows\Prefetch\ can show if executables were run
  • The AppCompatCache registry key and AmCache.hve hive contain more detailed information on program execution, though neither logs individual execution instances or command line options
  • You can diff the filesystem – have a clean copy, either of the Master File Table or of the entire structure – and compare to see what’s changed; this is a fairly intensive operation, especially if you intend to see if a known good file has been replaced with a malicious version
  • There are tools for parsing registry hives so identifying new/modified keys is possible

Creating your own API call logging

  • If you’re a good enough programmer to write code that logs API calls, this is the gold standard. I am not (yet) up to this. It is possible to monitor for most of the interesting events such as process and file creation, registry modification etc. using filter drivers. If you want to go a step further and monitor (or even intercept and change) system calls, you need to be looking at DLL injection. This is the method used by Cuckoo sandbox, among many others.

Building monitoring in to the virtualisation

  • Technically this is all just code simulating hardware running other code. If you’re smart enough to modify a hypervisor so that it can recognise and log API calls within its guests, go for it. Please excuse me for thinking you’re a bit mad though!

Options #1, #2 and #4 hold an additional advantage of being difficult or impossible for sandbox evasion techniques to pick up on.

And then we get to Sysmon, which is in effect a version of #3, but it has a big advantage: somebody else did all the work for us! Hooray for Mark Russinovich and Thomas Garnier. Many sandboxes do API call monitoring; sometimes it can be a little bit excessively detailed (hello Cuckoo) but as far as understanding what malware is doing goes, it’s the bee’s knees. Let’s have a look at what you can get out of it.

Sysmon ProcessCreate event output

Sysmon Process Created event

We’ll ignore for now how much my UI leaves to be desired. Here is perhaps the most commonly of interest event to you: Process Created. In this event you have a wealth of data including not only the location of the executable, launch command and parent processes, but the MD5 and SHA256 hashes of the file. You can also get the import hash here too – though I’d forgotten to turn it on for this run. You can see what ran, from where, by whom, and how it was run, in a glance.

Sysmon File Created event output

Sysmon File Created event

Next up we can log the act of creating a file; in this case a trojan makes new copy of itself which is placed in C:\Users\<username>\System\Library\mshost.exe.

Sysmon Registry Value Set event data

Sysmon Registry Value Set event

You can also monitor for interesting things happening in the registry. This is one of the primary methods by which malware achieves “persistence”, i.e. the ability to remain active on the system it infects. Here we can see a new entry being created in one of the user’s Run keys.

Sysmon Network Connection output

Sysmon Network Connection event

In a final example, Sysmon allows you to detect initiation of network connections; not only do we have the network level data of the destination IP and port captured, but the destination hostname is also identified.

In just four event types, Sysmon is able to record the malware starting, hiding itself, achieving persistence, and contacting its Command and Control server. This is the power of logging API calls. But wait – there’s more! This only scratches the surface of what Sysmon can do. It is also capable of identifying:

  • A process changing the creation time of a file
  • Process termination
  • Loading of drivers
  • Loading of additional modules in to existing processes
  • Creation of threads within other running processes
  • Raw access to the disk (as opposed to using the file system APIs)
  • Access to another process’s memory
  • Creation of alternate data streams
  • Use of named pipes (a method of communicating between processes)
  • Use of Windows Management Instrumentation

As you can see, it’s a fantastic tool which would be pretty hard to top if you decided to try doing this yourself. If you are thinking of experimenting with malware – or looking for something to help you keep a closer eye on your systems in general – I can’t recommend it enough.

In part 3 I will discuss the use of IDS and packet capture tools to get detailed information on the malware’s communication.

20,000 leagues under the sand, part 1

Greetings, malware junkies!

Welcome to the first part in my mini epic documenting my journey of discovery into the world of sandboxing. If you come here expecting groundbreaking advances in the field, you may be disappointed. If however you want to see some of the ideas a newbie had so that you don’t have to think of them yourself, you might be in the right place. Also maybe seeing the dumb mistakes I made so you can avoid ’em 😊

This series is not intended to be a technical instruction manual on sandbox creation. What I intend to do is introduce and discuss the core problems and issues and outline potential approaches for solving them. Along the way I will give specific examples with some detail from the solutions I created for my own sandbox.

A long time ago in a SOC far, far away…

I started my project a little over a year ago, having spent at least that long watching someone else do this roll-your-own sandbox thing with no small amount of awe. Although I was fair with python and could bumble my way around Linux, Snort rules, pcaps and the like, the idea of reproducing this kind of feat even on the most modest scale seemed like a pipe dream. I saw malware go in, and not just pcaps and Snort alerts come out, but a wealth of host activity like file creation, shell commands, remote threads… you name it, it was there. I had the barest scraps of understanding about the Windows API and far less than that about how one might go about tracking something using it.

Without having had this project to look up to, I might have set my sights a little lower, but I was hooked and I wanted to do All Of The Things. I had a laundry list of features in mind based on the aforementioned project and other sandboxes I was beginning to learn about, including but not limited to:

  • Host activity logging
  • Full network capture
  • NIDS alerting
  • AV detection
  • Cross referencing samples on lots of IOCs
  • Screen capture
  • User behaviour simulation
  • Countering sandbox evasion

You might be forgiven for thinking I was a little mad with ambition. No, you’d definitely be forgiven, I was bananas.

However, around Christmas 2016, the biggest obstacle suddenly got a lot smaller when I realised that I already knew of a tool that could do most of the things that my lack of C/C++/WinAPI coding knowledge was preventing, a tool that was continually praised by a twitter account I follow whom I’m sure you have never heard of – Sysmon. I was (perhaps a little optimistically) certain that I could find ways to get my code working for all of the other components I wanted, so when that realisation hit I immediately started coding. If I had known how much of my time it would eat, I might have had second thoughts…

Anyway, from this moment my pet project was born. It’s clunky, ugly, and unreliable, but I’ve learned a lot! Folks, may I present The Antfarm.

In my next post I will talk about my starting place for this somewhat chaotic adventure: how one can detect and log actions and events on a host that may be malicious.

part 2 – Host activity monitoring

Collecting Netscaler appflow reverse proxy logs

TL/DR: python script to combine Netscaler reverse proxy HTTP request and response objects and output the result as an Apache-style log. Github repo is here: https://github.com/scherma/ipfixwatch

So the time came where your organisation decided it needs a new and shiny reverse proxy, hopefully before the current bucket of bolts went to the great big datacentre in the sky. It’ll be fun, they said. I told them we needed to talk about the definition of fun. They said they’d schedule a meeting.

This is not the right place to provide (nor am I really qualified) to give an in depth explanation of appflow; the short version is that it is a binary protocol for logging application-level information in a form that is more flexible than syslog. It has the benefit of having a well-defined structure, which is a plus from a log collection perspective, but being binary means parsing it is tricky and requires specialised tools.

So how can you get the juicy details out of that content? Easier said than done. Citrix will happily sell you an appliance; I leave it to the reader to imagine how many arms and legs the price might be. Ditto Splunk. Then there are the free/OSS options, which is where we arrive at Logstash.

Logstash can receive appflow (or ipfix/netflow) data, parse it, and output information summarising each appflow record. This is great and works (mostly). But when one starts looking at the output, a fly appears in the ointment: requests and responses are logged in separate records. This means that if you’re looking to replace your existing logs like for like, you could have a problem on your hands. Let’s take a look at some of the data. Here is the output in Logstash’s standard json format for a HTTP request:

{
    "@version":"1",
    "host":"10.0.50.4",
    "netflow":{
        "destinationIPv4Address":"10.0.50.5",
        "netscalerHttpReqUserAgent":"Mozilla/5.0",
        "destinationTransportPort":443,
        "netscalerHttpReqUrl":"/some/random/path?with=parameters&other=stuff",
        "sourceIPv4Address":"123.234.123.234",
        "netscalerHttpReqMethod":"GET",
        "netscalerHttpReqHost":"internalhost.unsafehex.com",
        "netscalerHttpReqReferer":"",
        "sourceTransportPort":1337,
        "netscalerHttpDomainName":"netscalerdemo.unsafehex.com",
        "netscalerTransactionId":2459675,
        "netscalerHttpReqXForwardedFor":""
    },
    "@timestamp":"2017-11-08T14:59:58.000Z",
    "type":"ipfix"
}

Plenty of useful information, but as you can see, nothing to indicate what response this request got. This is because the raw appflow packets from the Netscaler output the request and response as separate records, and Logstash is doing a literal translation of each binary record into a separate JSON object. Now let’s have a look at the corresponding response record:

{
    "@version":"1",
    "host":"10.0.50.4",
    "netflow":{
        "destinationIPv4Address":"123.234.123.234",
        "destinationTransportPort":1337,
        "sourceIPv4Address":"10.0.50.5",
        "netscalerHttpRspStatus":200,
        "sourceTransportPort":443,
        "netscalerHttpRspLen":35721,
        "netscalerTransactionId":2459675
    },
    "@timestamp":"2017-11-08T14:59:59.000Z",
    "type":"ipfix"
}

Fortunately for us, although it does not provide us the request and response in a single record, it does mark them as belonging to the same transaction, via the netscalerTransactionId field. This means that we are now able to combine the information and produce the information you might be expecting in an HTTP log.

Having discovered this this, I was able to throw together a python script which will read the JSON output of Logstash and rebuild the separate records into a unified message. At the time the Apache Extended format was the most suited for my requirements and so the current version of my script (here) writes this out to hourly log files. Given that the data becomes a python dict, it would be very easy to adapt this to whatever other format you are interested in.

The code’s clearly a hack job so if anyone feels like turning it into good code, I’d welcome the education. In any case, happy parsing!

A few notes:

  • ipfix, and hence appflow, are UDP protocols. There is no guarantee that Logstash will capture the corresponding response for every request, or vice versa. The script maintains a dict of currently-unmatched requests and responses for which there is a size limit to prevent it eating all of your memory. While Logstash is operating normally I have not seen any issues with unpaired request/response but it is theoretically possible.
  • If the script cannot match a request with a response, it will stay in memory until the script is stopped with SIGINT or keyboard interrupt, or the table size limit is reached. At this point, unpaired requests will be written to the output with a response code of 418. Unpaired responses will be discarded.
  • It won’t auto-create the output directory at this point. Sorry, forgot that part, I made them manually and didn’t think of it.

syslog-ng flat file collection: where did my program go?!

Using syslog-ng to forward logs is pretty nice, there’s plenty of documentation and the configuration is relatively easy to understand compared to other stuff out there (looking at you rsyslog), but that doesn’t mean everything is completely obvious. If you search for information on how to read a text file log with syslog-ng, you might come up with something like this:

source s_squid3access {
    file("/var/log/squid3/access.log" follow-freq(1)); };

Which checks the file /var/log/squid3/access.log for new entries every second. However, if you simply send this as is, you might end up with a message similar to the one below being sent to your syslog destination (note that I’ve modified my squid instance to log in the Apache Combined log format)

<13>1 2017-11-07T19:07:44+00:00 myproxy 192.168.1.4 - - [meta sequenceId="84"] - - [07/Nov/2017:19:07:43 +0000] "CONNECT www.netflix.com:443 HTTP/1.1" 200 12237 "-" "Mozilla/5.0 (Windows NT 10.0; Win64; x64) AppleWebKit/537.36 (KHTML, like Gecko) Chrome/62.0.3202.75 Safari/537.36" TCP_MISS:HIER_DIRECT

which corresponds to the following line in the log file:

192.168.1.4 - - [07/Nov/2017:19:09:03 +0000] "CONNECT www.netflix.com:443 HTTP/1.1" 200 5101 "-" "Mozilla/5.0 (Windows NT 10.0; Win64; x64) AppleWebKit/537.36 (KHTML, like Gecko) Chrome/62.0.3202.75 Safari/537.36" TCP_MISS:HIER_DIRECT

Note the position of the IP address in the syslog message – it is in the syslog header section in the position of the syslog program field. If you want to collect and parse this information in a SIEM for example, this will cause you quite the headache, as the message it attempts to interpret will begin “– – [07/Nov/2017:19:07:43 +0000]” rather than “192.168.1.4 – – [07/Nov/2017:19:07:43 +0000]“. It will no longer match the format of the data the collector is expecting (probably resulting in the message not getting parsed at all), and even if you tried fixing that, the missing data is a fairly crucial bit of info – there’s not much use knowing that someone visited a site if you can’t find out which user or host it was.

The answer is given in the syslog-ng documentation, although it is not immediately obvious. The section on collecting messages from text files hints that if the message does not have a syslog header, it may behave in an unusual way, but it does not explain in detail what will happen; for that you must look at the options for the file() method. In the description of the flags() option “no-parse” it notes that by default, syslog-ng assumes the first value in a log line is the syslog program. If you set this flag, your originating IP will again be part of the message section, and your SIEM/parsing will be happy again.

You can also set the program_override() option so that the program field is populated, as it is useful in certian SIEM/collection tools to have this info. Now your config file might look a bit like this:

source s_squid3access {
    file("/var/log/squid3/access.log" follow-freq(1) flags(no-parse) program_override("squid3")); };

and all should be well. Happy logging!

Bonding rituals

I may have been quiet on here but not because I haven’t been doing lots of fun nerdy stuff. Unfortunately, there’s a fair amount of it that can’t be blogged about, hence the lack of new material here, but a problem came up the other day that was a royal pain in the ass pretty fun and interesting, and maybe some folks out there might be scratching their heads over it and appreciate there being something in the depths of t’interwebs to explain it.

Bonding is a pretty damn useful thing, especially to us NSM folks. Take a 1×1 tap and run the output cables up to a nice bit of tin running $distro_of_choice, a few minutes of tweaking interface config files, and hey presto! a bonded interface with both directions of traffic for Snort/Suricata/Bro/whatever to listen to, and your kit is safely out of line where the sysadmins can’t blame you when something breaks and takes out the internet (they’ll probably still try though).

So far, so standard. The other day I needed to do this in a VM – no problem, I thought. VMWare will let you pass traffic through to the guest; you need to put the switch into promiscuous mode because the interface in your guest/sniffer won’t have an IP assigned, which you can do in the vSwitch Security Policy.

With each output of the tap assigned its own vSwitch which was attached to an individual interface on the guest, I created a bond interface to combine the two. In the very best tradition of here’s one I made earlier let someone else make and plagiarised shamelessly, you can read a good guide here.  One notable exception – use mode 0 (round robin) and not  active/passive – we want to combine the outputs, instead of having the second only work if the first fails.

So, having done that, I brought up the bond0 interface and… weirdness happened. I was only seeing one side of the traffic. tcpdump on the bond0 interface was only showing the responses, not the requests. The slaved interfaces told a similar story, one had traffic (inbound), and the other was silent. Odd. Next check, was the ESXi host seeing the traffic but not passing it through? Checking this requires the use of pktcap-uw rather than VMWare’s implementation of tcpdump, which will not let you look at traffic on individual vSwitches. This showed the traffic was indeed present.

Proper head-scratching time now. The interface settings were all correct, the problem persisted through restarts of the interfaces, the networking service, even the OS. Next step was bringing up each interface manually one at a time; now it got even weirder. eth1 showed responses as expected. eth2 showed requests – awesome! bond0 showed… just the responses. Checked eth2 and it was now silent as the grave. Curses! This didn’t change when bond0 was shut down again; outbound traffic would only reappear when eth2 was brought up without bond0. Enabling bond0 killed it again until it was started without bond0 running. What the hell?

Having pretty much run out of ideas, a bit of experimentation was on the cards, starting with the ESXi config settings. This was clearly a stroke of genius, because upon setting MAC address changes to ‘accept’, it instantly started working. Why would this be?

One of the things that enabling bonding does is that the bond0 interface defaults to starting with the MAC of the first interface to join the bond. In round-robin mode, it then shuttles its MAC address around each interface to receive frames; VMWare’s (sensible) default is to ignore changes like this, and as a result, will stop transmitting traffic to the interface it sees as having violated the restriction until the interface is bounced. Thus, the first slave to join will receive traffic because its MAC stays the same, and the second stops being sent data because the vSwitch has seen its MAC change. Permitting changes on the vSwitch means the MAC can be assigned as necessary.

TLDR: If you want to use a bonded interface in an ESXi guest like this, you must set ‘Allow MAC address changes’ to accept on the vSwitches the slave interfaces connect to.

ELK and Plex’s DNS barf

Recently I’ve been playing around with ELK – Elasticsearch, Logstash and Kibana, a set of tools for collecting, indexing, searching and representing data. It’s particularly good for handling logs, and if there’s anything I am all about, it’s logs. It’s pretty fun, and once you get over the initial terminology hurdles, surprisingly easy (at least, for my modest home lab’s requirements). I don’t expect to be writing a guide about how to set it up since there are plenty of decent ones out there already, but thought people might like a nice little example of the kind of thing you can do once it’s running.

One thing that it can do very readily is flag up unusual events on your network – providing you are collecting the relevant logs of course. For instance, so far I have it receiving logs from all of my *nix boxes, firewall, IDS and VPN. I would give it proxy logs too, if I could persuade squid not to keep breaking everything, but that’s another story. Anyway, in passing I noticed that the number of events received had spiked massively over a one hour period last night.

Logspike

Well that got my attention! I figured it was probably something to do with the fact that I had been migrating my media server, but was a little surprised to see just how big a jump it was. Fortunately one thing that Elasticsearch (the index/log storage backend) and Kibana (the shiny web interface and visualisation tool) make absurdly easy is turning a big number like this into something readily understandable.

First I needed to understand how the logs in this time period were different from the rest of the day which as you can see has a pretty constant level of about 8,000 events per hour. This is as simple as adding what Kibana terms a ‘sub_bucket’, which allows you to split the count up based on various criteria. In my case I can selected one of the fields that I have indexed, to show how much of that volume is coming from which program.

Logspike breakdown

From this I see that the traffic through the firewall (filterlog) has jumped by two or three times – somewhat interesting, but the real eye-opener is that nice mauve colour. That would be bind, my DNS service, and quick back-of-envelope maths says that’s a 20-fold increase. What’s the deal, yo?

Yet again, you can make this nice and obvious with Kibana. If I filter down to just the logs coming from bind, I can then start breaking it down by one of the fields I’m extracting from the bind logs, the queried hostname.

Analyzed

And here we have two runaway culprits, lyricfind.plex.tv and lastfm-z.plexapp.com. That would be because when I stood up a new Plex server I hadn’t moved my old library data over. Plex therefore decided it needed to look up every item in my library, with DNS queries going out for each file.

This is a very small example and I’ve barely scraped the surface of what Kibana or the other tools are capable of, but hopefully it shows you how you can rapidly dig in to your data to get the story behind something that happened, and see it in a way that doesn’t need Cypher to tell you which symbols are the blondes, brunettes and redheads.

Angler knows when you’re fakin’ it

A brief introduction to Angler for those who are new to it: Angler is a framework of malicious code that criminals can purchase/rent and deploy on web servers they have control over – usually ones they have compromised rather than renting for themselves. It is typically comprised of an initial component which is injected into a site you are likely to visit, which redirects you to the second location, known as the exploit kit landing page. The landing page has code which tests what features and capabilities your browser has, in order to identify whether you are vulnerable to any of the exploits the criminals have access to; this is known as “browser enumeration”. This page often contains the exploits themselves, but they can sometimes be called from another location. Finally the exploit will contain commands that will attempt to download and run a program, which could be anything – a remote access tool, ransomware, you name it. If you want to know a bit more about what comes out the business end of an Angler chain, there are many examples on places like Malware Don’t Need Coffee and Cisco Talos.

Angler has developed steadily, adding new features in its efforts to more effectively select vulnerable users, better evade detection, and increase the difficulty of analysing it. The creators have added polymorphism on all stages of the code so that it changes every time the page loads, making it much more difficult for antivirus and intrusion detection systems to recognise. There are up to three layers of obfuscation in the javascript. The most recent trick I have seen is a little call that doesn’t seem to do much in terms of sorting potential victims from the crowd, but made analysing it a bit more of a challenge.

1 raw page

The above image will be familiar to anyone who has investigated Angler. Dozens of variables with completely random names, and an eval to turn them into some valid code. Looks like this one has been inserted into a header PHP file of some sort as it’s appearing even before the opening HTML tags. This particular group becomes:

eval(String.fromCharCode.apply(null,document.getElementById("xndotnjmjwlj").innerHTML.split(" ")))

Getting the text from a hidden div and turning it from a series of character codes into text, then evaluating. The hidden div part is a bit new but nothing particularly special (previously it just put the text to decode directly in a string variable). That text becomes the following:

2 angler decoded div 1

On line 14 it is getting the code from another div and then feeding it through a loop which does some maths on the characters and constructs another string. That doesn’t sound too complicated, but try as I might I just could not get this code to do its stuff, not until I started stepping through it and watching what values got assigned to the variables in each step; and as it turns out, the problem is on the very first line.

kaypkiafgibrwvp = (+[window.sidebar])

The lines that follow it create a loop with this value as the start, and test whether the strings “rv:11” and “MSIE” are present in the user agent – a fairly standard way of detecting what browser is coming to call. Why was this code not running properly? Presumably if it’s a for loop this code should start with kaypkiafgibrwvp being 0, so let’s check that bit – in fact you can try this out yourself. Bring up the developer console in your browser (Firefox: ctrl+shift+k; Chrome: ctrl+shift+i; IE: F12) and put the text in the box into the console. In IE, Chrome and Safari, you’ll get “0”. But in Firefox and some javascript debugging tools, you’ll get “NaN”.

That “NaN” breaks the code – it will never send your browser anywhere. So in order to get this code to turn out something useful, I’ll need to replace at least that value with 0 rather than the output of the expression. The other value that’s set here from browser variables, othddelxtnfae, is used as a modulus a bit further down so it’s necessary to make sure that one’s correct too; a little tinkering showed that the correct value for this variable was 2 – indicating the UA must contain “rv:11” or “MSIE10”, but not both.

3 final redirect formatted

And there you have it, an iFrame hidden off the top of the page, going to the next part of Angler.

Given that the call to window.sidebar only eliminates one of the major browsers from contention it seemed unlikely to me that this would be the reason for including it – an anti-analysis technique seemed more likely. A bit of searching reveals that this is because some popular analysis tools depend on open source code from the Firefox javascript engine… and Trustwave basically wrote everything in this post two days ago. Lesson learned: analysis first, beauty sleep later.