20,000 Leagues Under The Sand – Part 2
As a newbie sandboxer, the biggest obstacle for me was finding a way of getting in-depth information on what actions were being performed by malware I wanted to test. In particular, I wanted to be able to drop some samples, go away and make lunch, then come back and be looking at some results. That meant stepping through it in a debugger was out, or at least a lesson for another day. You’ve probably already seen that I ended up using Sysmon, but let’s have a look at the alternatives for a moment.
Built in Windows logging
- Windows 10 and Server 2016 have the option of enabling process audit logging. This will capture the command line that caused a process to be launched which is a very useful bit of information.
- Registry auditing is possible, and can be managed by group policy or manual editing of the registry.
Filesystem forensics
- The files in C:\Windows\Prefetch\ can show if executables were run
- The AppCompatCache registry key and AmCache.hve hive contain more detailed information on program execution, though neither logs individual execution instances or command line options
- You can diff the filesystem – have a clean copy, either of the Master File Table or of the entire structure – and compare to see what’s changed; this is a fairly intensive operation, especially if you intend to see if a known good file has been replaced with a malicious version
- There are tools for parsing registry hives so identifying new/modified keys is possible
Creating your own API call logging
- If you’re a good enough programmer to write code that logs API calls, this is the gold standard. I am not (yet) up to this. It is possible to monitor for most of the interesting events such as process and file creation, registry modification etc. using filter drivers. If you want to go a step further and monitor (or even intercept and change) system calls, you need to be looking at DLL injection. This is the method used by Cuckoo sandbox, among many others.
Building monitoring in to the virtualisation
- Technically this is all just code simulating hardware running other code. If you’re smart enough to modify a hypervisor so that it can recognise and log API calls within its guests, go for it. Please excuse me for thinking you’re a bit mad though!
Options #1, #2 and #4 hold an additional advantage of being difficult or impossible for sandbox evasion techniques to pick up on.
And then we get to Sysmon, which is in effect a version of #3, but it has a big advantage: somebody else did all the work for us! Hooray for Mark Russinovich and Thomas Garnier. Many sandboxes do API call monitoring; sometimes it can be a little bit excessively detailed (hello Cuckoo) but as far as understanding what malware is doing goes, it’s the bee’s knees. Let’s have a look at what you can get out of it.
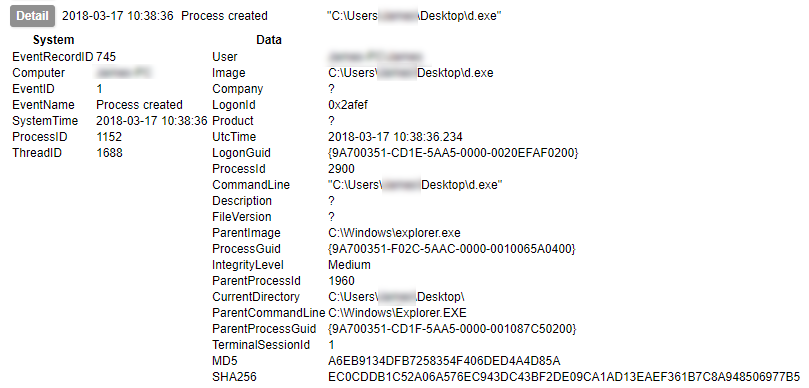
Sysmon Process Created event
We’ll ignore for now how much my UI leaves to be desired. Here is perhaps the most commonly of interest event to you: Process Created. In this event you have a wealth of data including not only the location of the executable, launch command and parent processes, but the MD5 and SHA256 hashes of the file. You can also get the import hash here too – though I’d forgotten to turn it on for this run. You can see what ran, from where, by whom, and how it was run, in a glance.
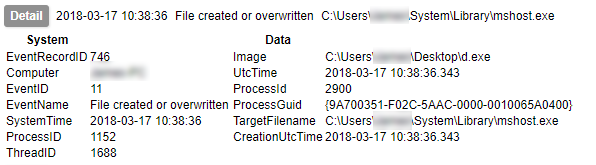
Sysmon File Created event
Next up we can log the act of creating a file; in this case a trojan makes new copy of itself which is placed in C:\Users\<username>\System\Library\mshost.exe.
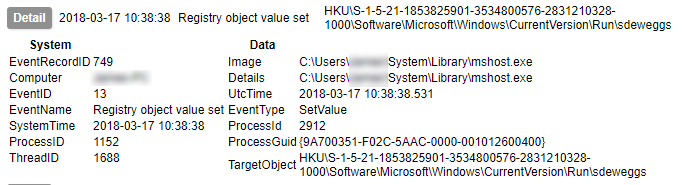
Sysmon Registry Value Set event
You can also monitor for interesting things happening in the registry. This is one of the primary methods by which malware achieves “persistence”, i.e. the ability to remain active on the system it infects. Here we can see a new entry being created in one of the user’s Run keys.
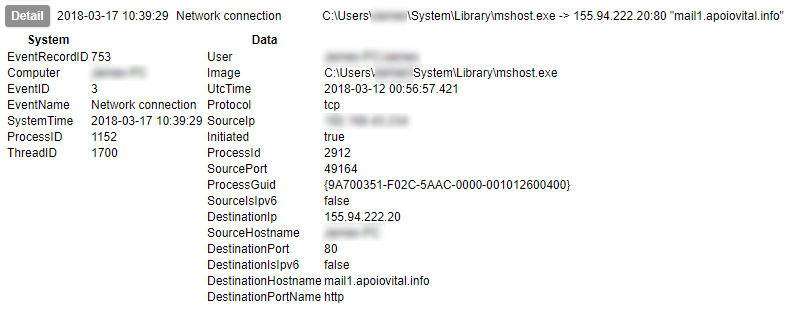
Sysmon Network Connection event
In a final example, Sysmon allows you to detect initiation of network connections; not only do we have the network level data of the destination IP and port captured, but the destination hostname is also identified.
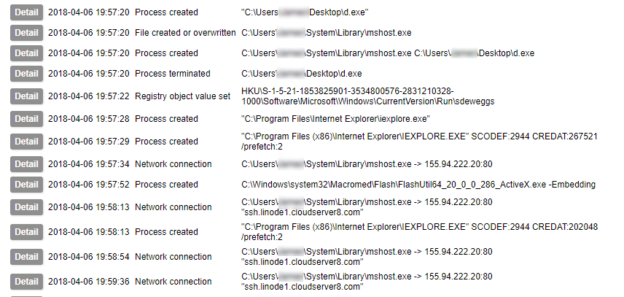
In just four event types, Sysmon is able to record the malware starting, hiding itself, achieving persistence, and contacting its Command and Control server. This is the power of logging API calls. But wait – there’s more! This only scratches the surface of what Sysmon can do. It is also capable of identifying:
- A process changing the creation time of a file
- Process termination
- Loading of drivers
- Loading of additional modules in to existing processes
- Creation of threads within other running processes
- Raw access to the disk (as opposed to using the file system APIs)
- Access to another process’s memory
- Creation of alternate data streams
- Use of named pipes (a method of communicating between processes)
- Use of Windows Management Instrumentation
As you can see, it’s a fantastic tool which would be pretty hard to top if you decided to try doing this yourself. If you are thinking of experimenting with malware – or looking for something to help you keep a closer eye on your systems in general – I can’t recommend it enough.
In part 3 I will discuss the use of IDS and packet capture tools to get detailed information on the malware’s communication.