PFSense, Suricata, and Splunk: mildly complicated, but very doable

I run a home lab, with a bunch of VMs running vaguely security-related tools, with a PFSense router in front of everything. On PFSense, I am running Suricata on several interfaces. I also collect the data in to a Splunk instance (❤️ developer license).

The Problem

You can forward data into Splunk with syslog. Ingesting syslog in to Splunk is not the easiest way to collect data – ideally you want to use a Splunk Universal Forwarder – (n.b. do not configure Splunk indexers or forwarders to listen for syslog directly! Use a dedicated syslog server!), but PFSense can forward its syslog natively, and Suricata alerts get written to syslog – so why not use that?

Well, because the data that Suricata puts in a syslog event is next to useless.

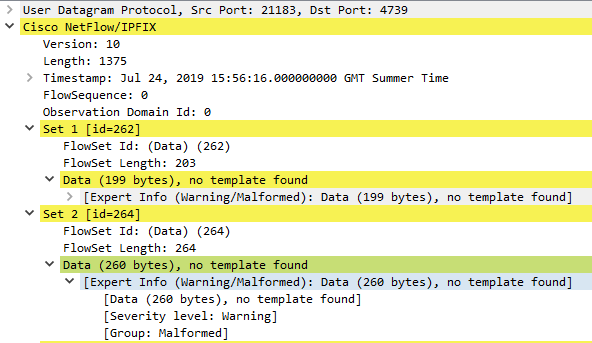
02/28/2023-20:18:38.695473  [**] [1:2016683:3] ET WEB_SERVER WebShell Generic - wget http - POST [**] [Classification: Potentially Bad Traffic] [Priority: 2] {TCP} 118.232.97.242:56937 -> <REDACTED>:80

A signature name, a source, and a destination. That’s it. Nothing to really let you understand what was happening underneath. What you really want is the Suricata eve.json output, which PFSense very helpfully allows you to enable. This contains a wealth of data, like the raw packet (in base64), decoded protocol elements like HTTP request headers, the URL, a DNS query – but although you can view these in the PFSense web UI, they are not covered by the native log management. What else could we use?

Splunk is easiest when you use a Splunk forwarder. Always use one when you can! However, sometimes it’s not the right choice… technically you can run the Forwarder on PFSense, as it’s FreeBSD, and there is a FreeBSD build of the forwarder. However, it has some drawbacks: you’ll find that although you appear to be able to enable boot-start, it doesn’t actually work. PFSense manages the set of services that run at boot and anything that is not an official PFSense package won’t get started. I’d been running it like this for ages, and given that I only rebooted my firewall once every six months or so, it was only a minor headache. If you’re running it as a production box though, that’s very much not ideal!

So, syslog is out, and a Splunk forwarder is problematic. What next?

Enter syslog-ng

PFSense is extensible, with a number of officially maintained add-on packages. Suricata is one. Another is the versatile syslog management engine, syslog-ng. Almost any way you can imagine of moving a log from one place to another, syslog-ng can do it for you. It could certainly scoop up files that aren’t covered by PFSense’s default syslog forwarding, and send them over to a syslog receiver. But. But.

syslog-ng can also write directly to the Splunk HTTP Event Collector (HEC). In fact, this is exactly what the Splunk Connect 4 Syslog package is under the hood – syslog-ng with a bunch of wrapping around it to make configuring it for a large number of Splunk inputs a bit less work. We don’t have that handy wrapping in PFSense, but it will absolutely let us do the necessary config manually, using an officially PFSense supported method. This post is therefore a step-by-step on how to set that up.

1. Groundwork

1.1 Splunk

You will need to have Splunk HEC set up. This part is covered by Splunk training (look in particular at the System Admin, Data Admin, and Architecting courses) and documentation so I will not rehash it here. However, as a brief summary, you will need to:

  • enable HEC and generate tokens
  • configure a load balancer (this is a non-Splunk item, but it is a critical step if you have a Splunk deployment with multiple indexers; do not direct HEC output at just one indexer in a cluster, it will do bad things to your Splunk deployment)

Tokens for a single-instance deployment can be found in Settings > Data Inputs > HTTP Event Collector. A HEC token looks like this in Splunk Web:

Extract from Splunk web interface showing a token named "sample_token", the edit/disable/delete links, and the token itself which is a GUID-style string of multiple hexadecimal blocks joined by dashes

Consult the documentation linked above for information about how to obtain the token if set up in a distributed deployment.

1.2 PFSense

  • Go to the System > Package Manager screen, search for the syslog-ng package, and install it

1.3 Network

Your PFSense device needs to be able to connect to the address of the HEC endpoint, on the appropriate port. The default port Splunk uses for this purpose is 8088. If using a load balancer, it must be able to connect to all Splunk indexers on the relevant port, and your PFSense device must also be able to connect to the load balancer. Test both of these things before starting to configure syslog-ng.

If you are intending to use a hostname to specify the Splunk instance / load balancer address, make sure that PFSense can resolve the hostname.

2. Configure syslog-ng

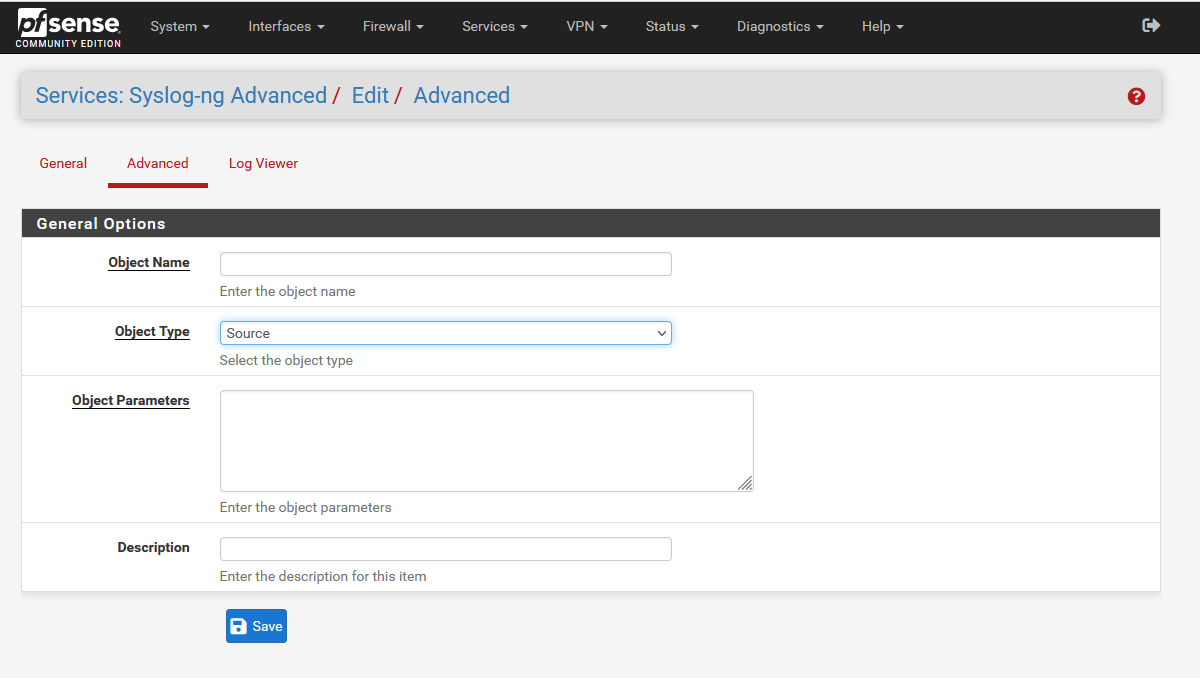
The most basic syslog-ng configuration has 3 components: a source, a destination, and a log directive that instructs syslog-ng to send source X to destination Y. The configuration needed for this use case is only a few minor tweaks away from this baseline. To begin configuring, navigate to Services > syslog-ng in the PFSense admin interface. You quite likely will not need to alter anything under the General tab. Configuring specific logging settings is done under the Advanced tab. Click Add to start writing a config.

2.1 The source

The “Object Type” for a source must be… Source. Sorry, no prizes for guessing that one.

Editing a config of syslog-ng in PFsense. There are blank fields labelled "Object Name", "Object Parameters" and "Description"; and a dropdown "Object Type" selected on "Source"

The “Object Name” is a unique identifier for the config stanza you are defining. There are few strict limitations, but it is a recommended convention to prefix source config names with “s_”, destination names with “d_” etc. The remainder should be brief, but descriptive. This config is to read the Suricata eve.json log files, so I have named it “s_suricata_eve_json”.

The “Object Parameters” define what is actually going to happen. To determine what to set, we must understand where and how the data we want to send exists.

PFsense stores Suricata logs in /var/log/suricata. It can run multiple instances of Suricata, one for each firewall interface. Every instance of Suricata gets its own directory within this path, and the logs are in these subdirectories.

Command line listing of /var/log/suricata showing multiple directories named after interfaces

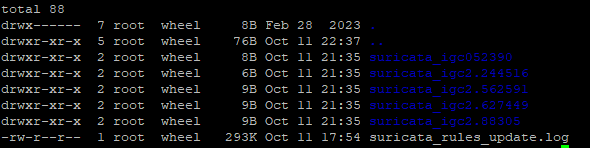
We could write a separate source stanza for each individual file, manually specifying the interface name. However, that way you would need to edit the config whenever you set Suricata on a new interface. We can instead watch all the directories at once.

Editing a config of syslog-ng in PFsense, showing an object of type "Source" with the title s_suricata_eve_json

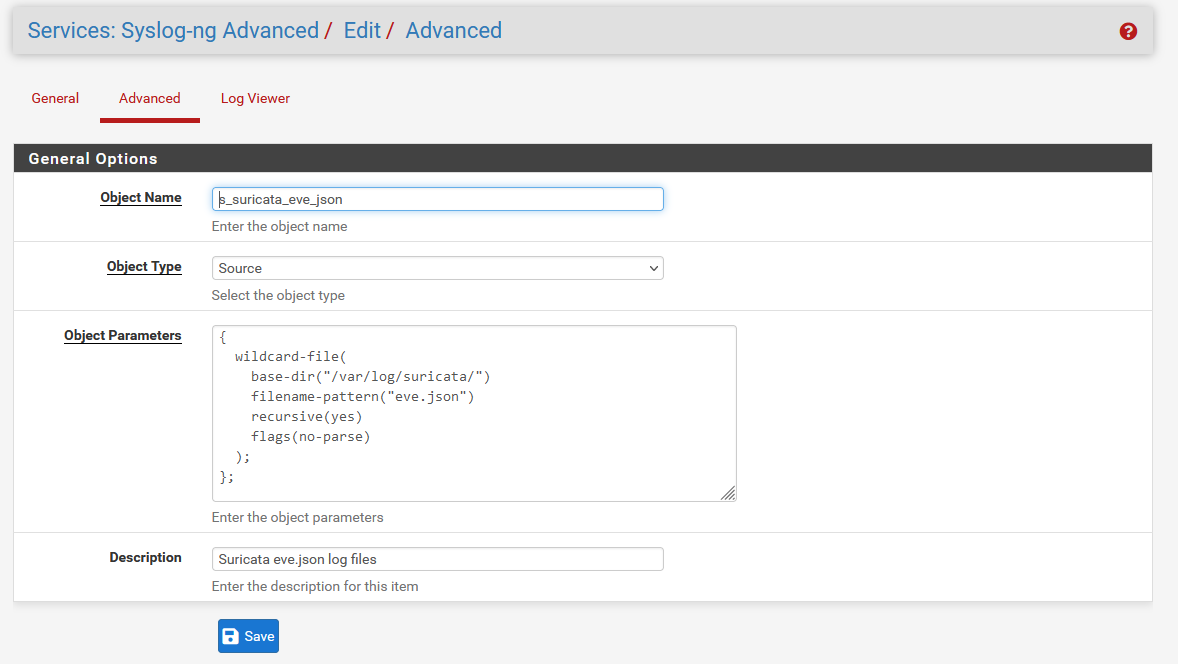
The wildcard-file option allows collecting multiple files, and can recursively search directories from a specified base path. That’s perfect for our use case. We specify the base-dir option to /var/log/suricata, set recursion to “yes”, and read all files named “eve.json”.

Additionally, the “no-parse” flag is set. This is because the default behaviour of syslog-ng is to attempt to interpret all messages as RFC-compliant syslog messages, where there is a set of default header fields such as syslog priority, timestamp, and host. Suricata eve.json events consist of a JSON object, with no header; trying to parse a syslog header from this results in improperly formatted JSON (and we need it to be valid JSON when it is sent to Splunk). This is the resulting definition:

{
  wildcard-file(
    base-dir("/var/log/suricata/")
    filename-pattern("eve.json")
    recursive(yes)
    flags(no-parse)
  );
};

Write a brief description, save this configuration, then click Add again for the next one.

2.2 The destination

You need to direct the events which are found in the source to your Splunk HEC receiver. Set the “Object Type” as “Destination”. My destination is labelled “d_splunk_suricata_hec”.

The syslog-ng option that allows sending data to HEC is the http() function. In this function we will define the destination (HEC endpoint host and the path “/services/collector/event” which is where Splunk HEC listener receives data), the token generated in step 1.1, and the HTTP body. The body is a JSON object with a specific set of fields that Splunk expects.

PFSense screenshot showing editing of a syslog-ng config set up to send to Splunk HEC

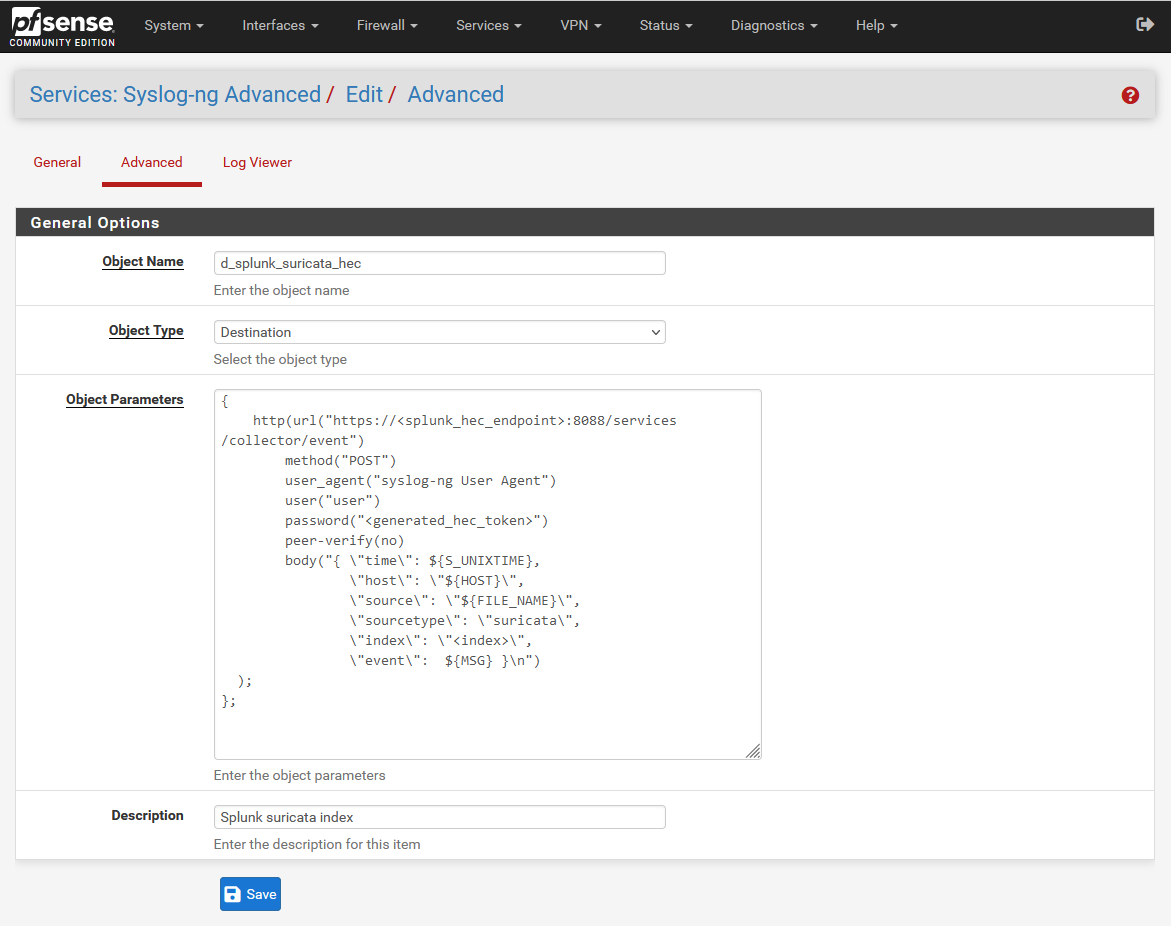
You must replace several elements of this with values specific to your environment:

  • <splunk_hec_endpoint> should be the IP or hostname of your load balancer, or of the Splunk instance if it is an all-in-one instance
  • <generated_hec_token> should be replaced with the token generated in step 1.1
  • In an ideal environment, you will be using proper certificate management with PKI; instead of setting peer-verify(no), you would load your organisation’s certificates into PFSense
  • <index> should be changed to the Splunk index you wish the logs to be sent to

After changing the values it should look something like this:

{
    http(url("https://172.16.3.9:8088/services/collector/event")
        method("POST")
        user_agent("syslog-ng User Agent")
        user("user")
        password("eb2cb049-3091-4b82-af1e-da11349a5e2b")
        peer-verify(no)
        body("{ \"time\": ${S_UNIXTIME},
                \"host\": \"${HOST}\",
                \"source\": \"${FILE_NAME}\",
                \"sourcetype\": \"suricata\",
                \"index\": \"suricata\", 
                \"event\":  ${MSG} }\n")
  );
};

Write a brief Description, save the configuration, and click Add to start writing the final part.

2.3 The log directive

Now that a source and destination have been defined, they can be connected together with a third stanza, where the “Object Type” is “Log”. This is the simplest of the three, and looks like so:

PFSense admin page showing a syslog-ng log stanza being configured

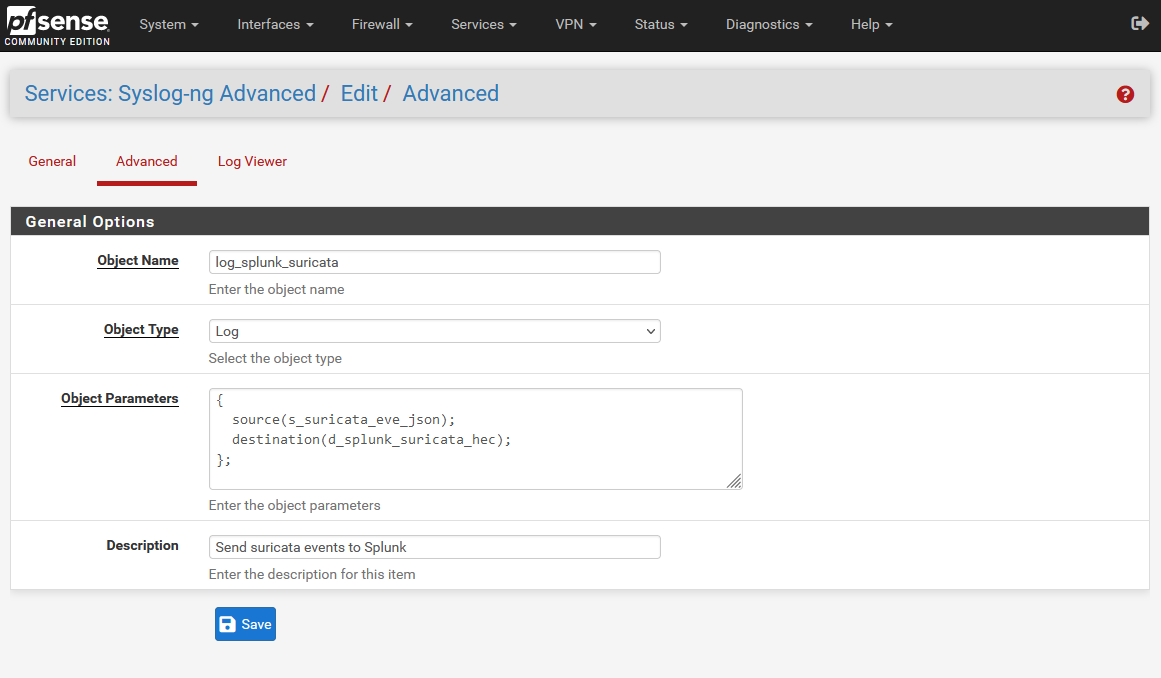
The source() function uses the Object Name chosen in step 2.1; the destination() function takes the name chosen in 2.2. Add these in, set an object name and description for this stanza, and save – and you should be rolling!

{ 
  source(s_suricata_eve_json);
  destination(d_splunk_suricata_hec); 
};

3. Checking your work

The first place to look is in the index you set as destination for Suricata events. Depending on how busy the device is, you might get dozens of events a minute, or only a few per hour. If you don’t see anything, try looking in the following places to see why:

3.1 Suricata logs on PFSense

You can see the events as they are written on the device under Services > Suricata > Logs View. If you have command line access you can also look in the filesystem at /var/log/suricata/<interface name>/eve.json.

3.2 syslog-ng logs on PFSense

Under Services > syslog-ng > Log Viewer, you can see recent messages from the syslog-ng service. Possible errors you could see here, and their causes include:

error sending HTTP request; url='https://<your host>:8088/services/collector/event', error='Couldn\'t resolve host name' 

PFSense could not look up the specified hostname via DNS; redo step 1.3

curl: error sending HTTP request; url='https://<your host>:8088/services/collector/event', error='SSL peer certificate or SSH remote key was not OK' 

the certificate is not trusted – you should specify peer-verify(no) if this is expected

Server returned with a 4XX (client errors) status code, which means we are not authorized or the URL is not found.; url='https://<your host>:8088/services/collector/event', status_code='400' 

the request wasn’t formatted correctly; you may have made a typo when constructing the text in the body() function

3.3 HEC logs in Splunk

If syslog-ng connects successfully but submits bad information, Splunk HEC will log an error. You can search for this with:

index=_internal component=HttpInputDataHandler

If the problem is badly formatted data, the messages aren’t hugely informative, but they are at least enough to confirm roughly what’s going on.

10-11-2023 20:31:45.580 +0100 ERROR HttpInputDataHandler [23746 HttpDedicatedIoThread-0] - Failed processing http input, token name=pfsense_syslog_ng, channel=n/a, source_IP=<syslog-ng source IP>, reply=6, events_processed=0, http_input_body_size=1046, parsing_err="While expecting event object key: Unexpected character: ':', totalRequestSize=1046"

When I encountered this, the only way I could think of to see what the problem was, was to write a second destination for syslog-ng where it would write events to a new file, using the same formatting text used in the body() function of the http() destination. I could then read the file and figure out which bit of the JSON was incorrect.

Hopefully now that I’ve shown exactly which bits to alter in this guide, you won’t have a need for that level of debugging! If you find messages like this, first re-read section 2.2 and check your destination stanza very carefuly against the example, for missing or extra characters.

4. Wrap up

If all went well, you now have all the eve.json events in Splunk, in all their lovely detail. If this has been helpful, I’d love to hear from you – or if there’s anything wrong or missing, please let me know. Happy Splunking!

Periscope header

Periscope: web page sandbox tool

Last year I made a handy little tool called Periscope. It lets you sandbox a web page and see all of what happens, without any risk to your browser. Since I was giving it a little love with some updates and UI improvements recently I decided it was high time I made a post about it 😊

Periscope is a CentOS/Red Hat targeted web app, written in NodeJS. Behind the scenes it runs an instance of Chromium (or Chrome) using the automation APIs (specifically the Puppeteer library) to drive that browser to a site of your choosing; then it records the resulting requests and responses.

The core of the app is a HTTP API with options to add a new site to be sandboxed, and retrieve the results.

> curl -XPOST http://localhost:3000/targets/add -H "Content-Type: application/json" -d '{"url": "https://httpstat.us/418"}'

{
  "visit":{
    "visit_id":301,
    "target_id":60,
    "createtime":"2021-01-08T19:04:02.000Z",
    "time_actioned":null,
    "completed":false,
    "screenshot_path":null,
    "status":"submitted",
    "settings":{
      "viewport":{
        "width":1903,
        "height":1064,
        "hasTouch":false,
        "isMobile":false,
        "isLandscape":true,
        "deviceScaleFactor":1
      },
      "userAgent":"Mozilla/5.0 (Windows NT 10.0; Win64; x64) AppleWebKit/537.36 (KHTML, like Gecko) Chrome/88.0.4324.182 Safari/537.36 Edg/88.0.705.74"
    }
  }
}

On top of this is a user interface in VueJS and Bootstrap, written to be responsive and mobile-friendly, and intuitive to use.

Features include:

  • Capturing a screenshot of the page
  • Recording all headers (names and values) in every request and response
  • Recording HTTP POST parameters
  • Storing full content of all results, downloadable by the user either individually or as a set (.tar.gz archive)
  • Indexed search of the header names and values
  • Using the Don’t FingerPrint Me extension to alert on attempts to fingerprint the browser

All of this lovely stuff is available for free (MIT license) on GitHub. Enjoy!

Zero-contact recon: a game to hone target research skills

A few weeks ago I was researching an entity and wanted to be completely hands-off with my recon methods and see what I could still obtain. The answer was: a lot. A heck of a lot, some of it incredibly valuable from an attacker’s perspective. I had also had in the back of my mind an intent to come up with some interesting workshops that my good friends in the Bournemouth Uni Computing and Security Society could have fun with. From these seeds, an idea was born: challenge people to find as much as possible using these methods, awarding points based on a finding’s value from the perspective of an attacker. Although it’s still very much a work in progress, I thought it might be worth sketching out my idea for people to try it, and get feedback.

This is something I hope can be of use to many people – the relevance to the pentesting community is pretty clear, but I also want to encourage my homies on the blue team to try this. If you use these techniques against your own organisation it has the potential to be of massive benefit.

Preparation

Select a target entity with an internet presence. The game’s organisers should research this entity themselves first, both to get an idea of the potential answers that competitors might give and assist scoring, and possibly to produce a map of known systems so that the no-contact rule can be enforced.

Set up an environment suitable for monitoring the competitors’ traffic and enforcing the rule. This might consist of an access point with some firewall logging to identify anyone connecting to the target’s systems directly, but organisers can choose any other method they deem suitable. If you trust participants to respect the rules enough, you could just decide not to do this part. It’s probably a good idea to at least have a quiet place with decent internet where you won’t be disturbed for the duration, and enough space for all the people taking part.

I would suggest that all participants should have a Shodan account. For students, good news – free! (at least in the US and UK, I don’t know about other locations)

Other tools that competitors should probably brush up on are whois, dig, and of course google your favourite search engine.

Rules

Competitors have a fixed time period to discover and record information relevant to an attacker who might wish to break in to the target’s network. Points will be scored for each piece of information based on how useful it is to this task. The time period can be decided by the organisers, but I think between one and two hours is a sensible period. The highest score achieved in the time period wins.

At the end of the period, competitors must provide a list of all their discoveries. The list must include a description of how each was found or a link to the source, sufficient for the judges to validate the finding’s accuracy. If there is insufficient information to verifiy a discovery, it shall receive no points.

No active connection to the target’s networks is permitted; this includes the use of VPNs and open proxies. Making active connections will be penalised, either by a points deduction or disqualification, at the judges’ discretion.

Points

ItemScore
Domains other than the target’s primary domain1pt each
* if domain can be confirmed as internal AD domain3pts each
Subsidiaries (wholly or majority owned)1pt each
Joint ventures2pts each
Public FQDNs/hostnames1pt each
Internet exposed services
* per unique protocol presented externally1pt each
* per unique server software identified1pt each
* per framework or application running on server (e.g. presence of struts, coldfusion, weblogic, wordpress)3pts each
* each version with known vulnerability
* RCE10pts each
* other vulns3pts each
ASNs1pt each
Format of employees’ emails3pts
Internal hostname convention5pts
Internal hostnames2pts each
Internal username convention5 pts
Internal usernames2pts each
Configuration fails (e.g. exposed RDP/SMB/SQL/Elastic/AWS bucket)5pts each
Individual confidential documents on internet3pts each
Large archive or collection of confidential documents on internet8pts each
Vendor/product name of internal products relevant to security/intrusion (e.g. AV/proxy/reverse proxy/IDS/WAF in use)4pts each

Any items discovered that apply to a subsidiary or joint venture are valid and to be included in the score.

A little help?

I’m intending to playtest this as soon as possible, but I would absolutely love to get feedback, regardless of whether I’ve already tested it. Please comment or tweet at me (@http_error_418) with suggestions for how to improve it, more items that can be scored, criticism of points balance… anything!

tstats: afterburners for your Splunk threat hunting

Recently, @da_667 posted an excellent introduction to threat hunting in Splunk. The information in Sysmon EID 1 and Windows EID 4688 process execution events is invaluable for this task. Depending on your environment, however, you might find these searches frustratingly slow, especially if you are trying to look at a large time window. You may also have noticed that although these logs concern the same underlying event, you are using two different searches to find the same thing. Is there anything we can do to improve our searches? Spoiler: yes!

One of the biggest advantages Splunk grants is in the way it turns the traditional model of indexing SIEM events on its head. Instead of parsing all the fields from every event as they arrive for insertion into a behemoth of a SQL database, they decided it was far more efficient to just sort them by the originating host, source type, and time, and extract everything else on the fly when you search. It’s a superb model, but does come with some drawbacks.

Some searches that might have been fast in a database are not so rapid here. Again, because there is no database, you are not constrained to predefined fields set by the SIEM vendor – but there is nothing to keep fields with similar data having the same name, so every type of data has its own naming conventions. Putting together a search that covers three different sources for similar data can mean having to know three different field names, event codes specific to the products… it can get to be quite a hassle!

The answer to these problems is datamodels, and in particular, Splunk’s Common Information Model (CIM). Datamodels allow you to define a schema to address similar events across diverse sources. For example, instead of searching

index=wineventlog EventCode=4688 New_Process_Name="*powershell.exe" 

and

index=sysmon EventCode=1 Image=*powershell.exe 

separately, you can search the Endpoint.Processes datamodel for process_name=powershell.exe and get results for both. The CIM is a set of predefined datamodels for, as the name implies, types of information that are common. Once you have defined a datamodel and mapped a sourcetype to it, you can “accelerate” it, which generates indexes of the fields in the model. This process carries a storage, CPU and RAM cost and is not on by default, so you need to understand the implications before enabling it.

Turn it up to 11

Let’s take this example, based on the fourth search in @da_667’s blog. In my (very limited) data set, according to the Job Inspector, it took 10.232 seconds to search 30 days’ worth of data. That’s not so bad, but I only have a few thousand events here, and you might be searching millions, or tens of millions – or more!

Splunk Job Inspector showing search time and cost breakdown

What happens if we try searching an accelerated datamodel instead? Is there much of a difference?

Splunk Job Inspector information for accelerated datamodel search

Holy shitballs yes it does. This search returned in 0.038 seconds, that’s nearly 270x faster! What sorcery is this? Well, the command used was:

| tstats summariesonly=true count from datamodel=Endpoint.Processes where Processes.process_name=powershell.exe by Processes.process_path Processes.process

What’s going on in this command? First of all, instead of going to a Splunk index and running all events that match the time range through filters to find “*.powershell.exe“, my tstats command is telling it to search just the tsidx files – the accelerated indexes mentioned earlier – related to the Endpoint datamodel. Part of the indexing operation has broken out the process name in to a separate field, so we can search for an explicit name rather than wildcarding the path.

The statistics argument count and the by clause work similarly to the traditional stats command, but you will note that the search specifies Processes.process_name – a quirk of the structure of data models means that where you are searching a subset of a datamodel (a dataset in Splunk parlance), you need to specify your search in the form

datamodel=DatamodelName[.DatasetName] where [DatasetName.]field_name=somevalue by [DatasetName.]field2_name [DatasetName.]field3_name

The DatasetName components are not always needed – it depends whether you’re searching fields that are part of the root datamodel or not (it took me ages to get the hang of this so please don’t feel stupid if you’re struggling with it).

Filtered, like my coffee

Just as with the Hurricane Labs blog, options for filtering and manipulating tstats output can be managed with the same operations.

| tstats summariesonly=true count from datamodel=Endpoint.Processes where Processes.process_name=powershell.exe NOT Processes.parent_process_name IN ("code.exe", "officeclicktorun.exe") by Processes.process_path Processes.process | `drop_dm_object_name("Processes")`

You can filter on any of the fields present in the data model, and also by time, and the original index and sourcetype. The resulting data can be piped to whatever other manipulation/visualisation commands you want, which is particularly handy for charts and other dashboard features – your dashboards will be vastly sped up if you can base them on tstats searches.

You’ll also note the macro drop_dm_object_name – this reformats the field names to exclude the Processes prefix, which is handy when you want to manipulate the data further as it makes the field names simpler to reference.

A need for speed

How do I get me some of this sweet, sweet acceleration I hear you ask? The first thing to understand is that it needs to be done carefully. You will see an increase in CPU and I/O on your indexers and search heads. This is because the method involves the search head running background searches that populate the index. There will be a noticeable increase in storage use, with the amount depending on the summary range (i.e. time period covered by detailed indexing) and how busy your data sources are.

With this in mind, you can start looking at the Common Information Model app and the documentation on accelerating data models. I highly recommend consulting Splunk’s Professional Services before forging ahead, unless your admins are particularly experienced. The basic process is as follows:

  • Ensure that your sourcetypes are CIM compliant. For most Splunk-supported apps, this is already done.
  • Ensure that you have sufficient resources to handle the increased load
  • Deploy the CIM app
  • Enable acceleration for the desired datamodels, and specify the indexes to be included (blank = all indexes. Inefficient – do not do this)
  • Wait for the summary indexes to build – you can view progress in Settings > Data models
  • Start your glorious tstats journey
Configuration for Endpoint datamodel in Splunk CIM app
Detail from Settings > Data models

Datamodels are hugely powerful and if you skim through the documentation you will see they can be applied to far more than just process execution. You can gather all of your IDS platforms under one roof, no matter the vendor. Get email logs from both Exchange and another platform? No problem! One search for all your email! One search for all your proxy logs, inbound and outbound! Endless possibilities are yours.

One search to rule them all, one search to find them… happy Splunking!

Collecting Netscaler web logs

A little while ago I wrote about collecting AppFlow output from a Citrix Netscaler and turning it into Apache-style access logs. Whilst that might technically work, there are a few drawbacks – first and foremost that Logstash gobbles CPU cycles like nobody’s business.

Furthermore, since the Netscaler outputs separate AppFlow records for request and response, if you want a normal reverse proxy log, you need to put them back together yourself. Although I have already described how to achieve that, as you can see above it is also not terribly efficient. So, is there a better way? There certainly is!

NetScaler Web Log Client

In order to deliver responses to requests correctly, the Netscaler must track the state of connections internally. Instead of creating our own Frankenstein’s Monster of a state machine to reassemble request and response from AppFlow, it would be much simpler if we could get everything from a place that already has the combined state. The good news is that Citrix have provided a client application to do just that. The bad news is that their documentation is a little on the shonky side, and it isn’t always clear what they mean. To fill in some of the gaps, I have written a brief guide to getting it running on CentOS 7. I will assume for this that you have installed CentOS 7 Minimal and updated it through yum.

Obtain the client

Citrix’s description of where to find the client on their site isn’t terribly helpful. Here’s how to get there at the time of writing:

    Citrix Portal > Downloads > Citrix Netscaler ADC > Firmware > [your version] > Weblog Clients

Prep the Netscaler

Ensure Web logging is turned on

    System > Settings > Configure Advanced Features > Web Logging

Ensure remote authentication is OFF for the nsroot user (not expecting many people to encounter this problem but it’s not easy to troubleshoot – the client just shows an authentication failure even if you entered the password correctly)

    System > User Administration > Users > nsroot > Enable External Authentication

Install and configure the NSWL client

Extract the .rpm from the zip downloaded from the Citrix portal and transfer it to your CentOS system. Run the following commands as root:

    $> yum install glibc.i686
    $> rpm -i nswl_linux-[citrix_version].rpm

You need to be able to connect from the system you are running the client on to your Netscaler reverse proxy on port 3011.

    $> nc -v [netscaler_ip] 3011

Add the target IP and nsroot account credentials to the config file as described in the Citrix docs (yes, some of their instructions are accurate – just not everything):

    $> /usr/local/netscaler/bin/nswl -addns -f /usr/local/netscaler/etc/log.conf

Edit the config file to set the format, log output directory, rotation settings etc.

----extract from /usr/local/netscaler/etc/log.conf----
logFormat    NCSA %h %v %l %u %p [%t] "%r" %s %j %J %{ms}T "%{referer}i" "%{user-agent}i"
logInterval			Daily
logFileSizeLimit		1024
logFilenameFormat		/var/log/netscaler/nswl-%{%y%m%d}t.log
------------------------------------------------------

Note: Citrix do not appear to provide a complete breakdown of what format strings are accepted, so I used the Apache documentation as a reference. However, not all of the variables are supported by the NSWL client, and some work in a different manner than expected. For example, %D does not output microseconds, but the %{UNIT}T style does work.

Configure a service to run the NSWL client

    $> vim /etc/systemd/system/nswl.service

[Unit]
Description=nswl

[Service]
Type=simple
User=nswl
Group=nswl
ExecStart=/usr/local/netscaler/bin/nswl -start -f /usr/local/netscaler/etc/log.conf	

[Install]
WantedBy=multi-user.target

    $> useradd -d <log directory> -s /sbin/nologin nswl
    $> chown -R nswl:nswl <log directory>
    $> systemctl daemon-reload
    $> service nswl start

SIEM configuration and log rotation

The logFormat directive shown above is similar to the standard Apache Combined format, but not identical. To parse the output, a slightly tweaked version of the regex is necessary:

^(?<src_ip>\S+) (?<site>\S+) (?:-|(?<ident>\S+)) (?:-|(?<user>\S+)) (?<dest_port>\d+) \[[^\]]*] "(?<request>[^"]+)" (?<status>\d+) (?<request_bytes>\d+) (?<response_bytes>\d+) (?<response_time>\d+) "(?:-|(?<http_referer>[^"]*))" "(?:-|(?<http_user_agent>.*))"

You should use a prefix pattern to match files to collect – do NOT use a suffix pattern like ‘*.<extension>‘ to track files. The NSWL client creates a new file with ‘.<number>‘ appended under many circumstances, including when the service is restarted, when the logFileSizeLimit is reached, and others. For example, if the service was restarted while writing to ‘nswl-20191001.log‘, it would begin writing ‘nswl-20191001.log.0‘.

Make sure to take this into account when configuring log rotation – e.g. move the files before compressing: ‘$> gzip nswl-20191001.log‘ results in ‘nswl-20191001.log.gz‘, which matches the pattern ‘nswl-*‘; SIEM agents may consider the latter file to be new and index it again, resulting in duplicate data.

Results

Using 1% CPU and a single process as opposed to the previous method of attempting to melt a CPU into the motherboard substrate is a definite improvement. Another plus is that it’s an officially supported tool, so in theory if something’s not working you can actually get some help with it.

I’m pretty proud of my eldritch horror of a python script, it ran for nearly two years in production with no significant problems (unlike Logstash which needed CPR every 6 weeks or so), but it’s high time my code was retired.

Remcos lettin’ it all hang out

I don’t post (or even tweet) very much about the malware going through my sandbox; in most cases it has been blogged about by more than one person in way more depth than I could. The other day, however, one stood out in my feed for a few reasons –

  • it was the first time I’d had a Remcos sample
  • contrary to what most blogs I read about it said, its C2 traffic was in the clear
  • despite knowing that Emerging Threats had multiple signatures explicitly for Remcos, I didn’t see any of them fire
Remcos C2 traffic

The content is exactly what one would expect – an array of values holding parameters of the infected host, separated by the string “|cmd|”, but no decryption was necessary.

Someone familiar with Remcos might also have spotted another odd feature from the above screenshot; the value “10.8.0.58” is the address of its C2 server. Given that my sandbox doesn’t have any route to a device with that address, these connections inevitably failed.

What is the point of having a private IP as a C2 server? Two possibilities spring to mind:

  • The sample was intended for a target network with an established foothold serving as an internal C2
  • It is an unfinished or test sample and the address is for the creator’s lab C2 server

I lean strongly toward the latter, given who it was sent to and that the data was also unencrypted, though I’m open to other ideas.

SHA256:

65f79343dea4024d439ef00d9effa663c76e2d683d49a7327f64aef673efb9d3

Via squid and second host running tor

Intercepting SSL with squid proxy and routing to tor

There was a time when practically all malware communicated with its command and control (C2) servers unencrypted. Those days are long gone, and now much of what we would wish to see is hidden under HTTPS.  What are we to do if we want to know what is going on within that traffic?

Introduction

(for those who are unfamiliar with the HTTPS protocol and public key encryption)

The foundation of HTTPS is the Public Key Infrastructure. When traffic is to be encrypted, the destination server provides a public key with which to encrypt a message. Only that server, which is in possession of the linked private key, can decrypt the message. Public key, or asymmetric encryption, is relatively slow so instead of all traffic being secured with this, the client and server use this stage only to negotiate a new key in secret for a symmetrically encrypted connection. If we wish to be able to read the traffic, we need to obtain the symmetric encryption key.

How can this be achieved? If we are in a position to intercept the traffic, we could provide a public key that we are in control of to the client, and establish our own connection to the server. The traffic would be decrypted at our interception point with our key, and re-encrypted as we pass it to the server with the server’s key. However, because HTTPS must be able to keep information confidential, it has defences designed with this attack in mind. A key issued by a server is normally provided along with the means to verify that it is genuine, not falsified as we wish to do. The key is accompanied by a cryptographic signature from a Certificate Authority (CA), and computers and other devices using HTTPS to communicate hold a list of CAs which are considered trustworthy and authorised to verify that keys are valid. Comparing the signature against the client’s stored list enables the client to verify the authenticity of the public key.

If we wish to inspect encrypted communication, we must both intercept the secret key during the exchange, and convince the client that the certificate it receives is genuine. This post will walk through the process needed to achieve those two goals.

Design

Starting point

I have already been running a sandbox that routes traffic via tor. It is loosely based on Sean Whalen’s Cuckoo guide, and implements the tor routing without going via privoxy, as shown below.

Initial setup

Using this method allows me to run malware without revealing the public IP of my lab environment. It has certain drawbacks; some malware will recognise that it is being routed via tor and stop functioning, however the tradeoff is acceptable to me.

squid | tor

Using squid with tor comes with some caveats that make the eventual configuration a little complicated. The version of squid I am using (3.5.23) cannot directly connect to a tor process running on the local host. In order to route via tor locally you will need a parent cache peer to which the connection can be forwarded. Privoxy is capable of serving this purpose, so initially I attempted the setup shown below:

Via privoxy

This configuration will function just fine if all you want is to proxy via squid. Unfortunately, this version of squid does not support SSL/TLS interception when a parent cache is being used. So, since we cannot use privoxy, and squid cannot route to tor on the same host, what can we do? Run tor on a different host!

Via squid and second host running tor

Implementation

squid with ssl intercept/ssl-bump

In order to use squid with ssl-bump, you must have compiled squid with the –with-openssl and –enable-ssl-crtd options. The default package on Debian is not compiled this way, so to save you some time I have provided the commands I used to compile it:

apt-get source squid
cd squid3-3.5.23/
./configure --build=x86_64-linux-gnu --prefix=/usr --includedir=${prefix}/include --mandir=${prefix}/share/man --infodir=${prefix}/share/info --sysconfdir=/etc --localstatedir=/var --libexecdir=${prefix}/lib/squid3 --srcdir=. --disable-maintainer-mode --disable-dependency-tracking --disable-silent-rules 'BUILDCXXFLAGS=-g -O2 -fdebug-prefix-map=/build/squid3-4PillG/squid3-3.5.23=. -fstack-protector-strong -Wformat -Werror=format-security -Wdate-time -D_FORTIFY_SOURCE=2 -Wl,-z,relro -Wl,-z,now -Wl,--as-needed' --datadir=/usr/share/squid --sysconfdir=/etc/squid --libexecdir=/usr/lib/squid --mandir=/usr/share/man --enable-inline --disable-arch-native --enable-async-io=8 --enable-storeio=ufs,aufs,diskd,rock --enable-removal-policies=lru,heap --enable-delay-pools --enable-cache-digests --enable-icap-client --enable-follow-x-forwarded-for --enable-auth-basic=DB,fake,getpwnam,LDAP,NCSA,NIS,PAM,POP3,RADIUS,SASL,SMB --enable-auth-digest=file,LDAP --enable-auth-negotiate=kerberos,wrapper --enable-auth-ntlm=fake,smb_lm --enable-external-acl-helpers=file_userip,kerberos_ldap_group,LDAP_group,session,SQL_session,time_quota,unix_group,wbinfo_group --enable-url-rewrite-helpers=fake --enable-eui --enable-esi --enable-icmp --enable-zph-qos --enable-ecap --disable-translation --with-swapdir=/var/spool/squid --with-logdir=/var/log/squid --with-pidfile=/var/run/squid.pid --with-filedescriptors=65536 --with-large-files --with-default-user=proxy --enable-build-info='Debian linux' --enable-linux-netfilter build_alias=x86_64-linux-gnu 'CFLAGS=-g -O2 -fdebug-prefix-map=/build/squid3-4PillG/squid3-3.5.23=. -fstack-protector-strong -Wformat -Werror=format-security -Wall' 'LDFLAGS=-Wl,-z,relro -Wl,-z,now -Wl,--as-needed' 'CPPFLAGS=-Wdate-time -D_FORTIFY_SOURCE=2' 'CXXFLAGS=-g -O2 -fdebug-prefix-map=/build/squid3-4PillG/squid3-3.5.23=. -fstack-protector-strong -Wformat -Werror=format-security' --with-openssl --enable-ssl-crtd
make && make install

The configuration above is identical to the precompiled one in the Debian Stretch repository, apart from the addition of the SSL options. If you are using a different distro the above command may not work.

Most of my configuration is based on the guide in the official squid documentation. My squid configuration is as follows:

acl ftp proto FTP
acl SSL_ports port 443
acl SSL_ports port 1025-65535
acl Safe_ports port 80 # http
acl Safe_ports port 21 # ftp
acl Safe_ports port 443 # https
acl Safe_ports port 70 # gopher
acl Safe_ports port 210 # wais
acl Safe_ports port 1025-65535 # unregistered ports
acl Safe_ports port 280 # http-mgmt
acl Safe_ports port 488 # gss-http
acl Safe_ports port 591 # filemaker
acl Safe_ports port 777 # multiling http
acl CONNECT method CONNECT
acl LANnet src 192.168.80.0/24 # local network for virtual machines
acl step1 at_step SslBump1
http_access deny !Safe_ports
http_access deny CONNECT !SSL_ports
http_access allow localhost manager
http_access allow LANnet
http_access deny manager
http_access allow localhost
http_access deny all
http_port 3128 intercept # intercept required for transparent proxy
https_port 3129 intercept ssl-bump \
    cert=/etc/squid/antfarm.pem \
    generate-host-certificates=on dynamic_cert_mem_cache_size=4MB
ssl_bump peek step1
ssl_bump bump all
sslcrtd_program /usr/lib/squid/ssl_crtd -s /var/lib/ssl_db -M 4MB
sslcrtd_children 8 startup=1 idle=1
access_log daemon:/var/log/squid/access.log logformat=combined
pid_filename /var/run/squid/squid.pid
coredump_dir /var/spool/squid
refresh_pattern ^ftp: 1440 20% 10080
refresh_pattern ^gopher: 1440 0% 1440
refresh_pattern -i (/cgi-bin/|\?) 0 0% 0
refresh_pattern . 0 20% 4320
request_header_access X-Forwarded-For deny all
httpd_suppress_version_string on
always_direct allow all

Use the SSL certificate generation process shown in the linked guide. Once you have created the .pem file, copy the section from —–BEGIN CERTIFICATE—– to —–END CERTIFICATE—– into a new file with the extension .crt.

A few notes here:

  • The ‘intercept’ keyword is necessary if you are using iptables to redirect ports to squid as a transparent proxy. If you configure your client to explicitly use a proxy, you should not use it.
  • The always_direct clause is used because we are routing squid’s output to another host (running tor) as the default gateway. If you wanted to use the squid → privoxy → tor configuration locally, you would use ‘never_direct’ instead.
  • The path for the ssl_crtd tool in Debian is /usr/local/squid/ssl_crtd – no libexec.
  • When setting permissions for the cache directories in Debian, use “proxy:proxy” instead of “squid:squid” as this is the default user that Debian creates to run the squid service.

In order for the virtual machine to treat the falsified public keys as genuine, we must instruct it to trust the certificate as created above. For a Windows 7 host like mine, double click the .crt file and import the certificate in to the Trusted Root Certification Authorities store.

Importing a cert

With squid set up and certificate imported, you must then configure iptables on the hypervisor host to redirect traffic through squid.

iptables -t nat -A PREROUTING -i virbr0 -p tcp --dport 80 -j REDIRECT --to-port 3128
iptables -t nat -A PREROUTING -i virbr0 -p tcp --dport 443 -j REDIRECT --to-port 3129

where virbr0 is the name of the virtual interface in QEMU. You should adjust interface name and destination ports as required for your setup.

tor service

On the second host I have installed tor (version 0.2.5.16 from Debian Stretch repo). This is configured with ports to listen for TCP and DNS connections in /etc/tor/torrc:

TransPort 192.168.42.2:8081
DNSPort 192.168.42.2:53

Then with iptables, inbound traffic from the hypervisor host is redirected to tor:

-A PREROUTING -s 192.168.42.4/32 -i eth0 -p tcp -j REDIRECT --to-ports 8081
routing

Since the objective is to keep my real IP hidden, care must be taken to ensure the host’s routing does not leak information. In /etc/network/interfaces, instead of specifying a gateway, I added two routes:

up route add -net 192.168.0.0 netmask 255.255.0.0 gw 192.168.40.1
up route add -net 0.0.0.0 netmask 0.0.0.0 gw 192.168.40.2

This causes all traffic not intended for my internal network to be routed to the host running the tor service (on 192.168.40.2). I have then configured my firewall so that it only allows connections reaching in to this VLAN, or from the tor host, not from the malware VM hypervisor.  When updates are required, connectivity can be enabled temporarily, with the VMs paused or shut off. Alternative techniques include allowing the hypervisor host to update via tor (if I didn’t mind it being slow), or routing the traffic from the VMs without NAT and denying anything outbound from the VM network on my core router, but that’s something to look at another day.

With the gateways set up, the routing for the VM interface can then be applied on the hypervisor host:

iptables -t nat -A POSTROUTING -o eth0 -j MASQUERADE
iptables -A FORWARD -i virbr0 -j ACCEPT

After applying these rules you should have a fully functioning TLS/SSL intercept routed via tor. To test, start by attempting to resolve a few hostnames from the VM and verify that the traffic is hitting your tor service host BEFORE giving any web pages a spin. Move on to HTTP/HTTPS traffic once you are sure DNS is working correctly.

Usage

Once you have a functioning setup you should expect to see both HTTP and HTTPS URLs appearing in your squid access log. In addition, if you perform a packet capture on the hypervisor virtual interface (virbr0 in my case), you can use the key generated earlier to view the decrypted traffic in Wireshark. You will need to copy the private key section of the .pem file to a new file to use in Wireshark. When entering the protocol as described in the link above, use ‘http’ in lowercase – uppercase will not work.

importing an SSL key in wireshark

decrypted output of call to https://ipapi.co

BSides Workshop “My log obeys commands – Parse!”

Better late than never, as they say. Last week I went to BSides London, which was pretty awesome. In between hanging out with all sorts of awesome people and downing mojitos, I had the opportunity to present a workshop. It seemed to go pretty well – though I have definitely learned enough to improve it for next time.

The short version is that it was an introduction to the basic principles and techniques of log parsing, for people at the level of a junior SOC analyst. Minimal regex knowledge required.

Although I don’t have a recording of the workshop, I’m putting the slides up here in case they’re of use to anyone. Enjoy! If you have any questions, please tweet @http_error_418 😊

My log obeys commands – Parse!

Sandbox stealth mode: countering anti-analysis

20,000 Leagues Under The Sand – part 6

read part 5

As long as there are robbers, there are going to be cops. The bad guys know perfectly well that people will be trying to identify their malware, and have all sorts of anti-analysis tricks up their sleeves to evade detection. Malware will very often perform checks for common analysis tools and stop running if it identifies their presence. Since one of the most fundamental tools for a malware analyst is the use of a virtual machine, it is the subject of numerous and varied detection attempts in many families of malware.

Simple strings

In its default configuration, a virtual machine is likely to have a wide range of indicators of its true nature. For example, it is common for standard peripheral names to contain hints (or outright declarations) that they are virtual.

VirtualBox DVD indicator

VirtualBox DVD drive

This is likewise the case for QEMU/KVM among others. As well as peripheral devices, the CPU vendor information may also be an indicator:

Device Manager processor info in QEMU/KVM

Device Manager processor info in QEMU/KVM

Less obvious to casual browsing but still perfectly simple for code running on the system to detect are features such as the CPUID Hypervisor Bit, MAC address, and registry key indications such as the presence of BOCHS or VirtualBox BIOS information in the registry.

SystemBiosVersion registry value

SystemBiosVersion registry value

These detections depend on the code of the hypervisor; in some cases they can be overcome by specifying particular configuration values, and in others they can only be solved by modifying the source code of the hypervisor and recompiling it. Fortunately for my choice of QEMU/KVM, many people have already looked at this particular problem and some have been generous enough to publish their solutions. There is also a fair amount of information out there for VirtualBox (partly because Cuckoo favours this hypervisor), and some for VMWare ESXi.

Bad behaviour

Another means of detecting an analysis environment is to collect information indicating the behaviour and use of the system. As discussed in part 4 of this series, simulating the presence of a user is an important ability to counter this evasion method. You should also consider environmental factors such as uptime (it is improbable that a user would boot a system and immediately run malware; some samples look for a minimum uptime period).

Presence of the abnormal, absence of the normal

One of the side effects of Windows being engineered to be helpful, is that it leaves behind traces of a user’s activity everywhere. In addition, people are messy. They leave crap scattered all over their desktop, fill their document folders with junk, and run all sorts of unnecessary processes. Looking for evidence of this is quite simple, and malware has been known to refuse to run if there are insufficient recent documents, or very few running processes.

Malware may also attempt to evade detection by searching for running and installed services and the presence of files linked to debuggers, analysis tools and the sandbox itself (e.g. VirtualBox Guest Additions).

Anti-analysis could be a series all of its own, and my understanding of it is still quite narrow. I strongly encourage you to research the topic yourself as there are tons of excellent articles out there written by authors with far more experience.

Presentation

Although it is not specific to sandboxing, I do not feel this series would be complete without some mention of the delivery of the output. You can write the best code to manage, control, and extract data from your sandbox in the world, but it is worthless if you cannot deliver it to your users in a helpful fashion. Think about what types of data are most important (IDS alerts/process instantiation/HTTP requests?), what particular feature of that data it is that makes it useful (HTTP hostname? destination IP? Alert signature name, signature definition?) and make sure that it is clearly highlighted – but you MUST allow the user to reach the raw data.

I cannot stress this enough. Sandboxes are a wonderful tool to get the information you need as a defender (though not everyone is so enthusiastic), but they are imprecise instruments. The more summarised and filtered the information is, the higher the chance it has to lead the analyst to false conclusions.

You should look at other sandboxes out there and draw inspiration, as well as learn what you want to avoid (whether because it’s too complicated for you right now, or you just think it’s a bad way of doing things) when making one yourself. Start by looking at Cuckoo, because it’s free and open source. Take a peek at the blogs and feature sheets of the commercial offerings like VMRay, Joe Sandbox, Hybrid Analysis, and the very new and shiny any.run.

Conclusion

Sandboxing is a huge topic and I haven’t begun to scratch the surface with this series. However, I hope that I have done enough to introduce the major areas of concern and provide some direction for people interested in dabbling in (or diving into) this fascinating world. I didn’t realise quite how much work it would be to reach the stage that I have; getting on for 18 months in, I’m still very much a novice and my creation, whilst operational, is distinctly rough around the edges. And on all of the flat surfaces. But it works! And I had fun doing it, and learned a ton – and that’s the main thing. I hope you do too.

Undocumented function “RegRenameKey”

Whilst learning some bits and pieces about the Windows API, I found a function that I wanted to use which does not appear to be documented on MSDN, “RegRenameKey”. Although Visual Studio will helpfully inform you of the datatypes required, it does not tell you what is expected within the datatypes. Since the answer doesn’t seem to be out there just yet I thought I’d do a quick writeup. The definition for the function is as follows:

LSTATUS WINAPI RegRenameKey( 
  _In_         HKEY    hKey, 
  _In_         LPCTSTR lpSubKeyName,
  _In_         LPCTSTR lpNewKeyName 
);

I assumed that lpSubKeyName and lpNewKeyName would accept the same form of input as the registry path expected for RegKeyCreate, e.g. “Software\\MyProduct\\MyKey”. However, attempting to use this returns error code 0x57 “The parameter is incorrect”. This is because lpNewKeyName seems to expect just a name without the path. A valid call looks like this:

 TCHAR keyname[] = L"Software\\testkey";
 TCHAR newkeyname[] = L"testkey2";
 LSTATUS renameerr = RegRenameKey(HKEY_CURRENT_USER, keyname, newkeyname);

Not a particularly difficult one, but hopefully this will save people some time!