There was a time when practically all malware communicated with its command and control (C2) servers unencrypted. Those days are long gone, and now much of what we would wish to see is hidden under HTTPS. What are we to do if we want to know what is going on within that traffic?
Introduction
(for those who are unfamiliar with the HTTPS protocol and public key encryption)
The foundation of HTTPS is the Public Key Infrastructure. When traffic is to be encrypted, the destination server provides a public key with which to encrypt a message. Only that server, which is in possession of the linked private key, can decrypt the message. Public key, or asymmetric encryption, is relatively slow so instead of all traffic being secured with this, the client and server use this stage only to negotiate a new key in secret for a symmetrically encrypted connection. If we wish to be able to read the traffic, we need to obtain the symmetric encryption key.
How can this be achieved? If we are in a position to intercept the traffic, we could provide a public key that we are in control of to the client, and establish our own connection to the server. The traffic would be decrypted at our interception point with our key, and re-encrypted as we pass it to the server with the server’s key. However, because HTTPS must be able to keep information confidential, it has defences designed with this attack in mind. A key issued by a server is normally provided along with the means to verify that it is genuine, not falsified as we wish to do. The key is accompanied by a cryptographic signature from a Certificate Authority (CA), and computers and other devices using HTTPS to communicate hold a list of CAs which are considered trustworthy and authorised to verify that keys are valid. Comparing the signature against the client’s stored list enables the client to verify the authenticity of the public key.
If we wish to inspect encrypted communication, we must both intercept the secret key during the exchange, and convince the client that the certificate it receives is genuine. This post will walk through the process needed to achieve those two goals.
Design
Starting point
I have already been running a sandbox that routes traffic via tor. It is loosely based on Sean Whalen’s Cuckoo guide, and implements the tor routing without going via privoxy, as shown below.
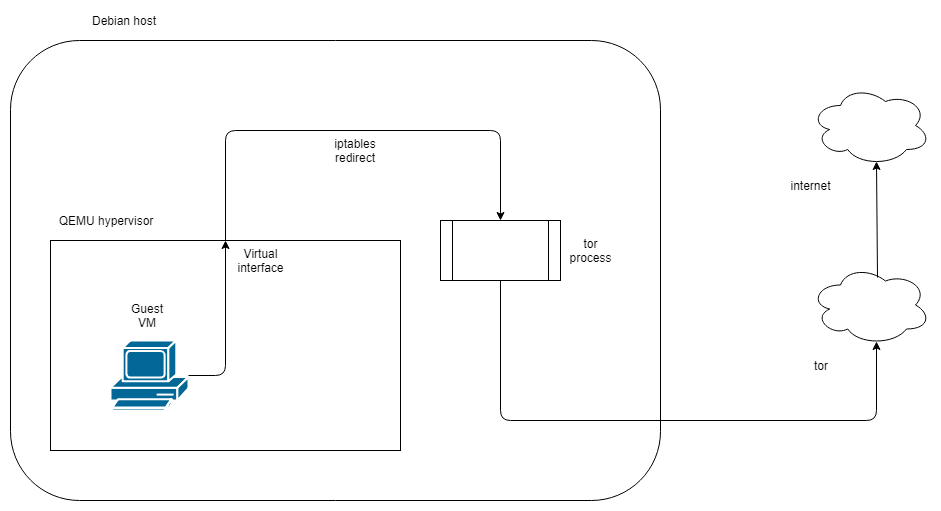
Initial setup
Using this method allows me to run malware without revealing the public IP of my lab environment. It has certain drawbacks; some malware will recognise that it is being routed via tor and stop functioning, however the tradeoff is acceptable to me.
squid | tor
Using squid with tor comes with some caveats that make the eventual configuration a little complicated. The version of squid I am using (3.5.23) cannot directly connect to a tor process running on the local host. In order to route via tor locally you will need a parent cache peer to which the connection can be forwarded. Privoxy is capable of serving this purpose, so initially I attempted the setup shown below:
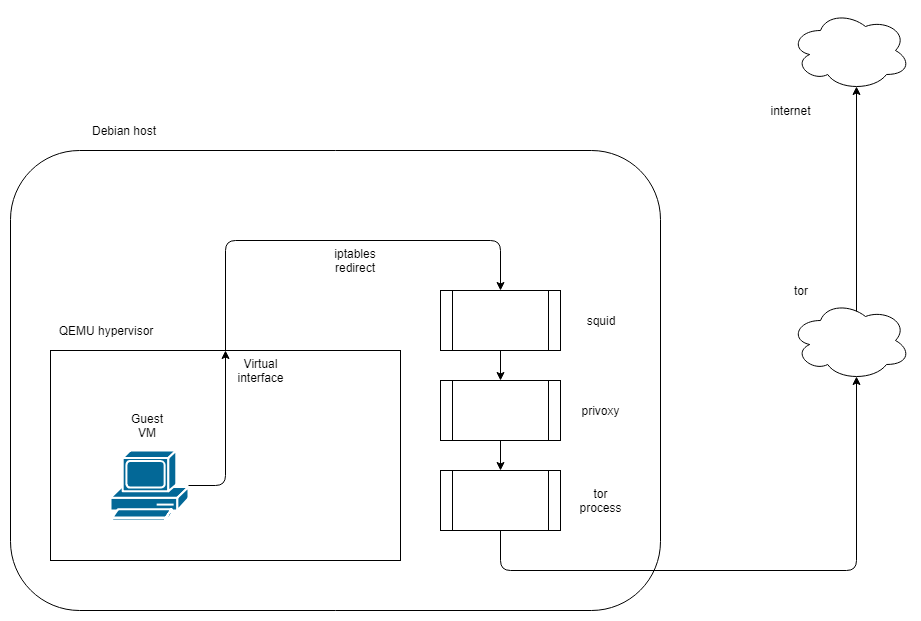
Via privoxy
This configuration will function just fine if all you want is to proxy via squid. Unfortunately, this version of squid does not support SSL/TLS interception when a parent cache is being used. So, since we cannot use privoxy, and squid cannot route to tor on the same host, what can we do? Run tor on a different host!
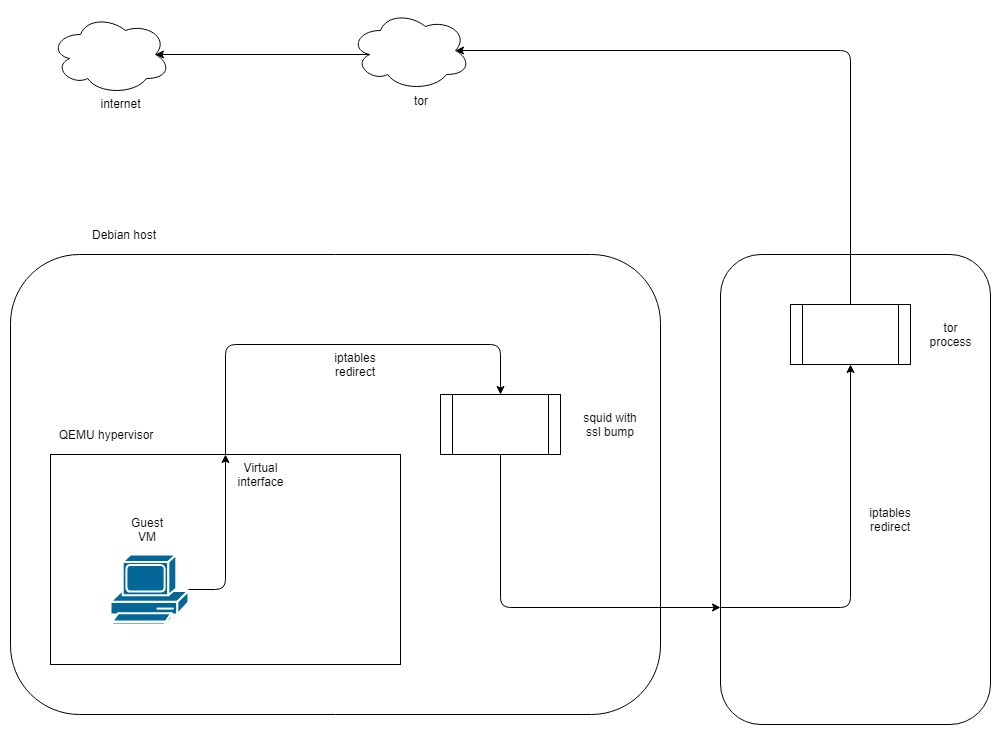
Via squid and second host running tor
Implementation
squid with ssl intercept/ssl-bump
In order to use squid with ssl-bump, you must have compiled squid with the –with-openssl and –enable-ssl-crtd options. The default package on Debian is not compiled this way, so to save you some time I have provided the commands I used to compile it:
apt-get source squid
cd squid3-3.5.23/
./configure --build=x86_64-linux-gnu --prefix=/usr --includedir=${prefix}/include --mandir=${prefix}/share/man --infodir=${prefix}/share/info --sysconfdir=/etc --localstatedir=/var --libexecdir=${prefix}/lib/squid3 --srcdir=. --disable-maintainer-mode --disable-dependency-tracking --disable-silent-rules 'BUILDCXXFLAGS=-g -O2 -fdebug-prefix-map=/build/squid3-4PillG/squid3-3.5.23=. -fstack-protector-strong -Wformat -Werror=format-security -Wdate-time -D_FORTIFY_SOURCE=2 -Wl,-z,relro -Wl,-z,now -Wl,--as-needed' --datadir=/usr/share/squid --sysconfdir=/etc/squid --libexecdir=/usr/lib/squid --mandir=/usr/share/man --enable-inline --disable-arch-native --enable-async-io=8 --enable-storeio=ufs,aufs,diskd,rock --enable-removal-policies=lru,heap --enable-delay-pools --enable-cache-digests --enable-icap-client --enable-follow-x-forwarded-for --enable-auth-basic=DB,fake,getpwnam,LDAP,NCSA,NIS,PAM,POP3,RADIUS,SASL,SMB --enable-auth-digest=file,LDAP --enable-auth-negotiate=kerberos,wrapper --enable-auth-ntlm=fake,smb_lm --enable-external-acl-helpers=file_userip,kerberos_ldap_group,LDAP_group,session,SQL_session,time_quota,unix_group,wbinfo_group --enable-url-rewrite-helpers=fake --enable-eui --enable-esi --enable-icmp --enable-zph-qos --enable-ecap --disable-translation --with-swapdir=/var/spool/squid --with-logdir=/var/log/squid --with-pidfile=/var/run/squid.pid --with-filedescriptors=65536 --with-large-files --with-default-user=proxy --enable-build-info='Debian linux' --enable-linux-netfilter build_alias=x86_64-linux-gnu 'CFLAGS=-g -O2 -fdebug-prefix-map=/build/squid3-4PillG/squid3-3.5.23=. -fstack-protector-strong -Wformat -Werror=format-security -Wall' 'LDFLAGS=-Wl,-z,relro -Wl,-z,now -Wl,--as-needed' 'CPPFLAGS=-Wdate-time -D_FORTIFY_SOURCE=2' 'CXXFLAGS=-g -O2 -fdebug-prefix-map=/build/squid3-4PillG/squid3-3.5.23=. -fstack-protector-strong -Wformat -Werror=format-security' --with-openssl --enable-ssl-crtd
make && make install
The configuration above is identical to the precompiled one in the Debian Stretch repository, apart from the addition of the SSL options. If you are using a different distro the above command may not work.
Most of my configuration is based on the guide in the official squid documentation. My squid configuration is as follows:
acl ftp proto FTP
acl SSL_ports port 443
acl SSL_ports port 1025-65535
acl Safe_ports port 80 # http
acl Safe_ports port 21 # ftp
acl Safe_ports port 443 # https
acl Safe_ports port 70 # gopher
acl Safe_ports port 210 # wais
acl Safe_ports port 1025-65535 # unregistered ports
acl Safe_ports port 280 # http-mgmt
acl Safe_ports port 488 # gss-http
acl Safe_ports port 591 # filemaker
acl Safe_ports port 777 # multiling http
acl CONNECT method CONNECT
acl LANnet src 192.168.80.0/24 # local network for virtual machines
acl step1 at_step SslBump1
http_access deny !Safe_ports
http_access deny CONNECT !SSL_ports
http_access allow localhost manager
http_access allow LANnet
http_access deny manager
http_access allow localhost
http_access deny all
http_port 3128 intercept # intercept required for transparent proxy
https_port 3129 intercept ssl-bump \
    cert=/etc/squid/antfarm.pem \
    generate-host-certificates=on dynamic_cert_mem_cache_size=4MB
ssl_bump peek step1
ssl_bump bump all
sslcrtd_program /usr/lib/squid/ssl_crtd -s /var/lib/ssl_db -M 4MB
sslcrtd_children 8 startup=1 idle=1
access_log daemon:/var/log/squid/access.log logformat=combined
pid_filename /var/run/squid/squid.pid
coredump_dir /var/spool/squid
refresh_pattern ^ftp: 1440 20% 10080
refresh_pattern ^gopher: 1440 0% 1440
refresh_pattern -i (/cgi-bin/|\?) 0 0% 0
refresh_pattern . 0 20% 4320
request_header_access X-Forwarded-For deny all
httpd_suppress_version_string on
always_direct allow all
Use the SSL certificate generation process shown in the linked guide. Once you have created the .pem file, copy the section from —–BEGIN CERTIFICATE—– to —–END CERTIFICATE—– into a new file with the extension .crt.
A few notes here:
- The ‘intercept’ keyword is necessary if you are using iptables to redirect ports to squid as a transparent proxy. If you configure your client to explicitly use a proxy, you should not use it.
- The always_direct clause is used because we are routing squid’s output to another host (running tor) as the default gateway. If you wanted to use the squid → privoxy → tor configuration locally, you would use ‘never_direct’ instead.
- The path for the ssl_crtd tool in Debian is /usr/local/squid/ssl_crtd – no libexec.
- When setting permissions for the cache directories in Debian, use “proxy:proxy” instead of “squid:squid” as this is the default user that Debian creates to run the squid service.
In order for the virtual machine to treat the falsified public keys as genuine, we must instruct it to trust the certificate as created above. For a Windows 7 host like mine, double click the .crt file and import the certificate in to the Trusted Root Certification Authorities store.
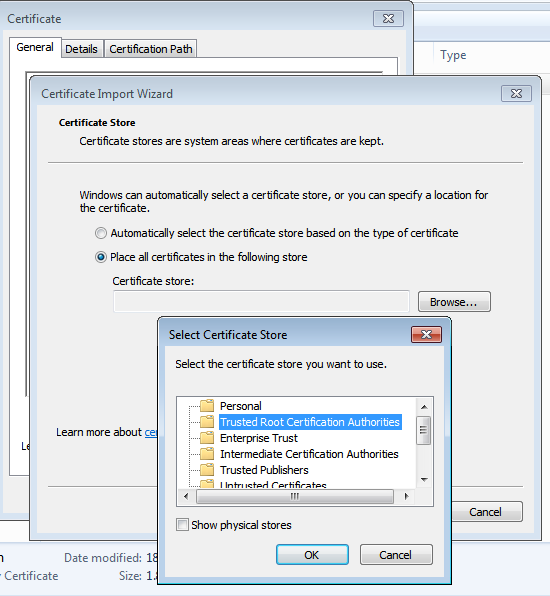
Importing a cert
With squid set up and certificate imported, you must then configure iptables on the hypervisor host to redirect traffic through squid.
iptables -t nat -A PREROUTING -i virbr0 -p tcp --dport 80 -j REDIRECT --to-port 3128
iptables -t nat -A PREROUTING -i virbr0 -p tcp --dport 443 -j REDIRECT --to-port 3129
where virbr0 is the name of the virtual interface in QEMU. You should adjust interface name and destination ports as required for your setup.
tor service
On the second host I have installed tor (version 0.2.5.16 from Debian Stretch repo). This is configured with ports to listen for TCP and DNS connections in /etc/tor/torrc:
TransPort 192.168.42.2:8081
DNSPort 192.168.42.2:53
Then with iptables, inbound traffic from the hypervisor host is redirected to tor:
-A PREROUTING -s 192.168.42.4/32 -i eth0 -p tcp -j REDIRECT --to-ports 8081
routing
Since the objective is to keep my real IP hidden, care must be taken to ensure the host’s routing does not leak information. In /etc/network/interfaces, instead of specifying a gateway, I added two routes:
up route add -net 192.168.0.0 netmask 255.255.0.0 gw 192.168.40.1
up route add -net 0.0.0.0 netmask 0.0.0.0 gw 192.168.40.2
This causes all traffic not intended for my internal network to be routed to the host running the tor service (on 192.168.40.2). I have then configured my firewall so that it only allows connections reaching in to this VLAN, or from the tor host, not from the malware VM hypervisor. When updates are required, connectivity can be enabled temporarily, with the VMs paused or shut off. Alternative techniques include allowing the hypervisor host to update via tor (if I didn’t mind it being slow), or routing the traffic from the VMs without NAT and denying anything outbound from the VM network on my core router, but that’s something to look at another day.
With the gateways set up, the routing for the VM interface can then be applied on the hypervisor host:
iptables -t nat -A POSTROUTING -o eth0 -j MASQUERADE
iptables -A FORWARD -i virbr0 -j ACCEPT
After applying these rules you should have a fully functioning TLS/SSL intercept routed via tor. To test, start by attempting to resolve a few hostnames from the VM and verify that the traffic is hitting your tor service host BEFORE giving any web pages a spin. Move on to HTTP/HTTPS traffic once you are sure DNS is working correctly.
Usage
Once you have a functioning setup you should expect to see both HTTP and HTTPS URLs appearing in your squid access log. In addition, if you perform a packet capture on the hypervisor virtual interface (virbr0 in my case), you can use the key generated earlier to view the decrypted traffic in Wireshark. You will need to copy the private key section of the .pem file to a new file to use in Wireshark. When entering the protocol as described in the link above, use ‘http’ in lowercase – uppercase will not work.
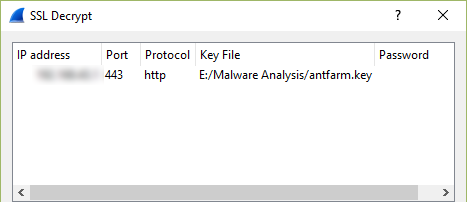
importing an SSL key in wireshark
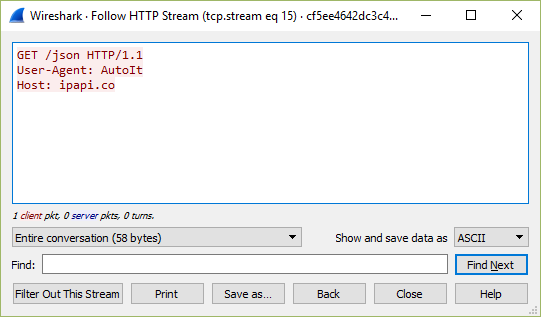
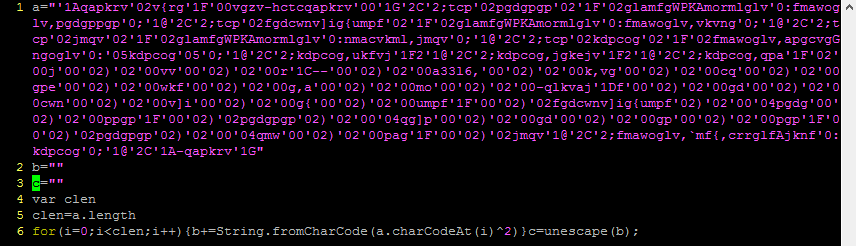
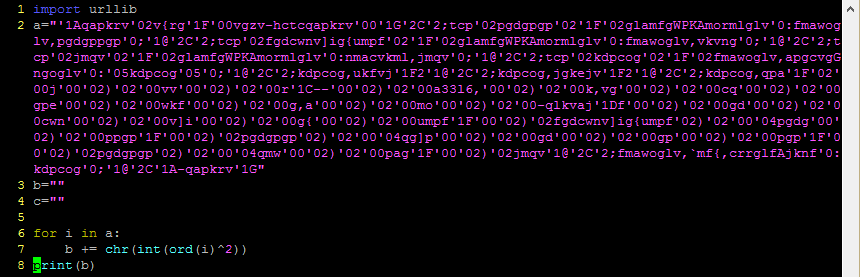
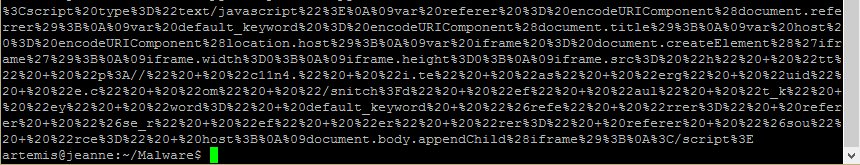
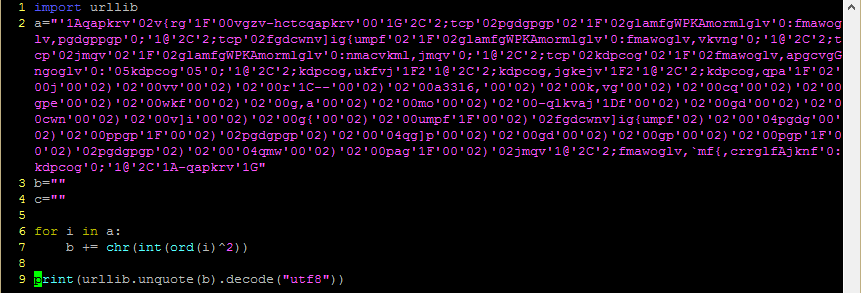
decrypted output of call to https://ipapi.co