Recently I’ve been playing around with ELK – Elasticsearch, Logstash and Kibana, a set of tools for collecting, indexing, searching and representing data. It’s particularly good for handling logs, and if there’s anything I am all about, it’s logs. It’s pretty fun, and once you get over the initial terminology hurdles, surprisingly easy (at least, for my modest home lab’s requirements). I don’t expect to be writing a guide about how to set it up since there are plenty of decent ones out there already, but thought people might like a nice little example of the kind of thing you can do once it’s running.
One thing that it can do very readily is flag up unusual events on your network – providing you are collecting the relevant logs of course. For instance, so far I have it receiving logs from all of my *nix boxes, firewall, IDS and VPN. I would give it proxy logs too, if I could persuade squid not to keep breaking everything, but that’s another story. Anyway, in passing I noticed that the number of events received had spiked massively over a one hour period last night.
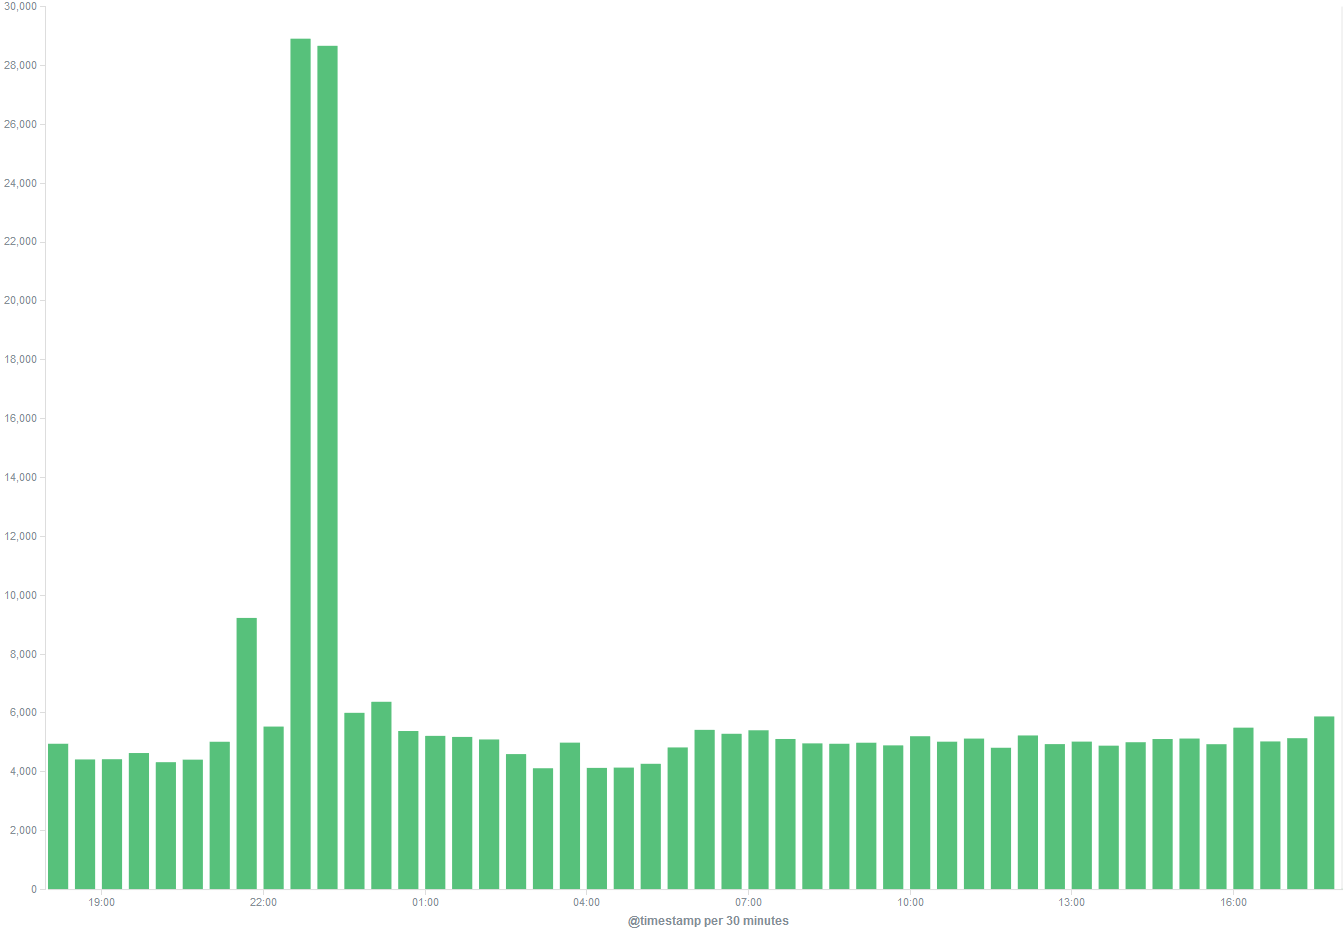
Well that got my attention! I figured it was probably something to do with the fact that I had been migrating my media server, but was a little surprised to see just how big a jump it was. Fortunately one thing that Elasticsearch (the index/log storage backend) and Kibana (the shiny web interface and visualisation tool) make absurdly easy is turning a big number like this into something readily understandable.
First I needed to understand how the logs in this time period were different from the rest of the day which as you can see has a pretty constant level of about 8,000 events per hour. This is as simple as adding what Kibana terms a ‘sub_bucket’, which allows you to split the count up based on various criteria. In my case I can selected one of the fields that I have indexed, to show how much of that volume is coming from which program.
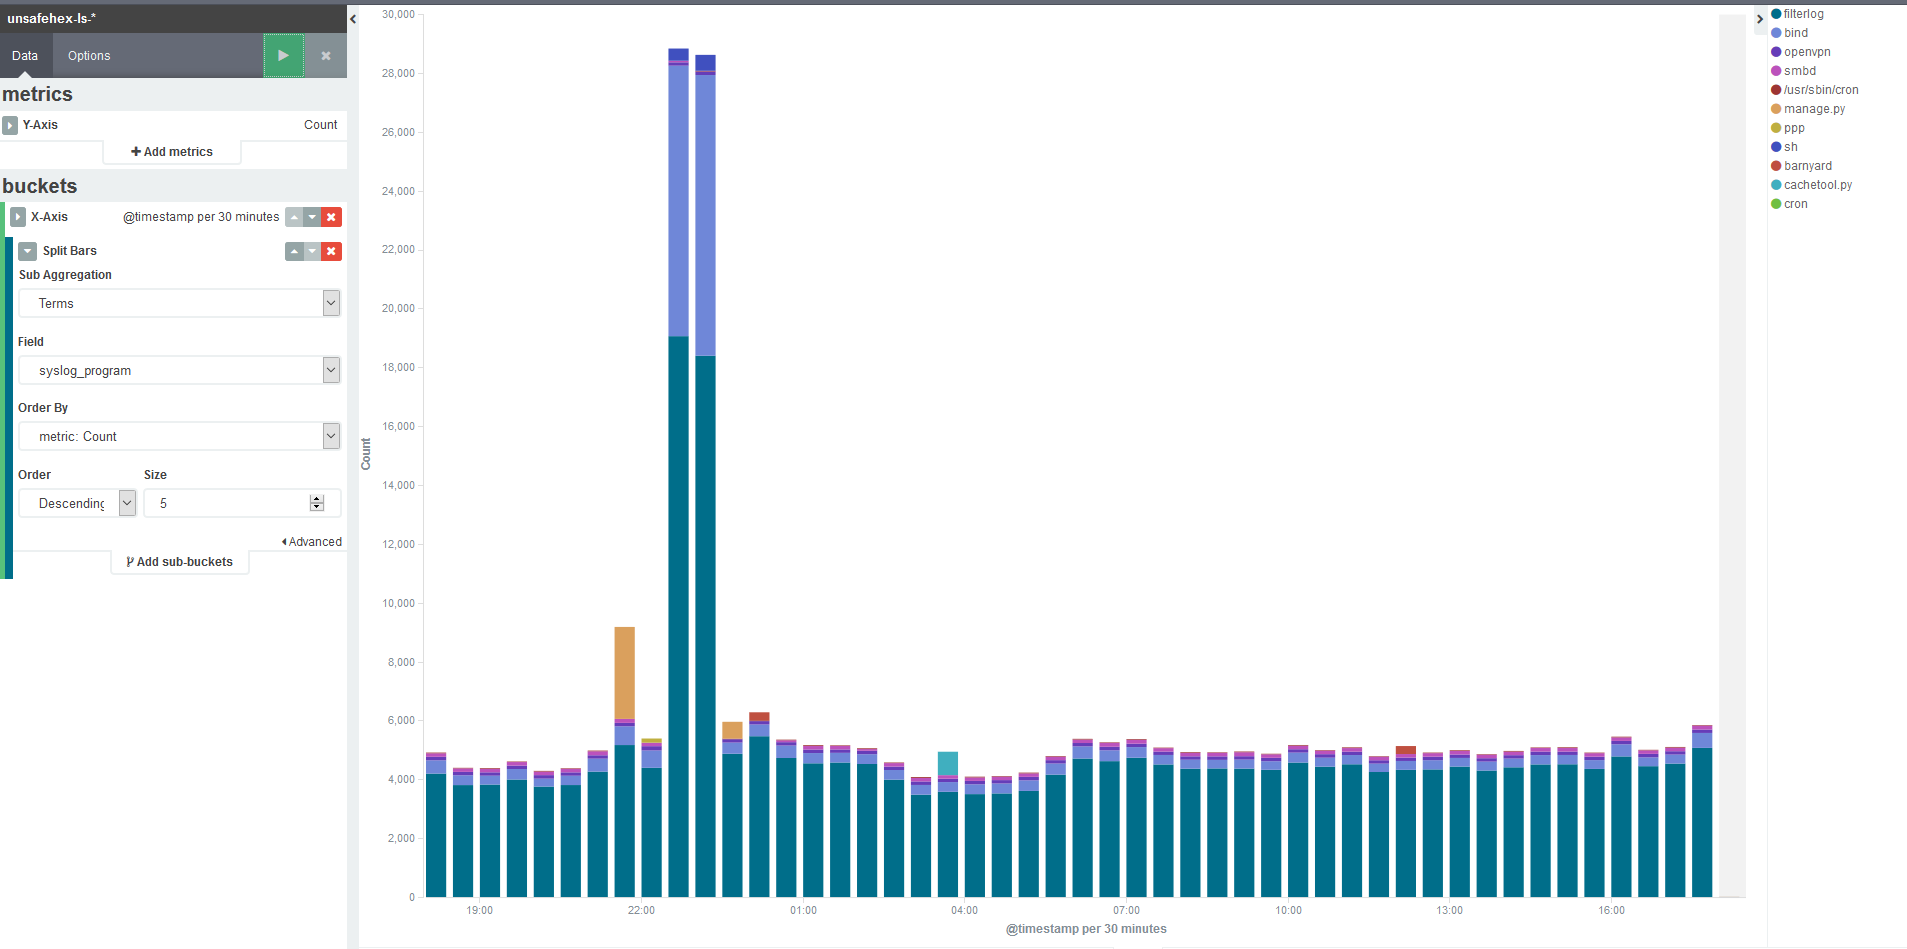
From this I see that the traffic through the firewall (filterlog) has jumped by two or three times – somewhat interesting, but the real eye-opener is that nice mauve colour. That would be bind, my DNS service, and quick back-of-envelope maths says that’s a 20-fold increase. What’s the deal, yo?
Yet again, you can make this nice and obvious with Kibana. If I filter down to just the logs coming from bind, I can then start breaking it down by one of the fields I’m extracting from the bind logs, the queried hostname.
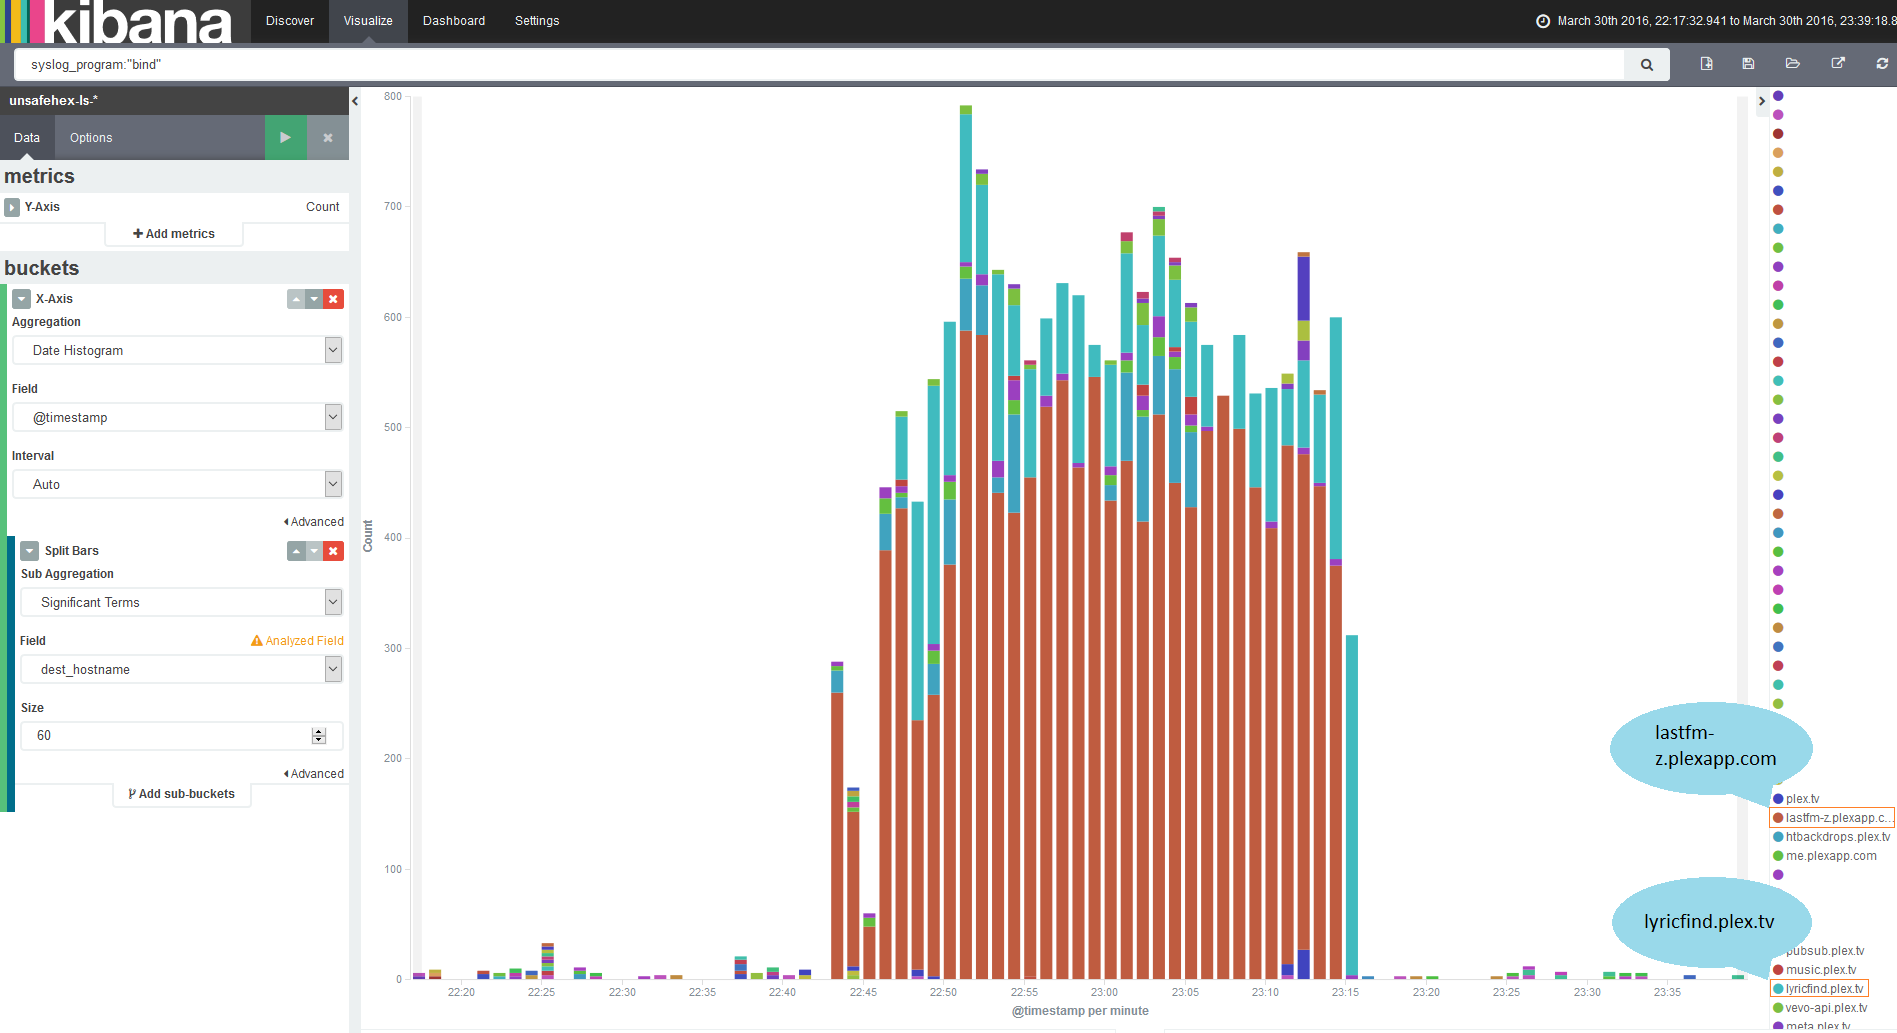
And here we have two runaway culprits, lyricfind.plex.tv and lastfm-z.plexapp.com. That would be because when I stood up a new Plex server I hadn’t moved my old library data over. Plex therefore decided it needed to look up every item in my library, with DNS queries going out for each file.
This is a very small example and I’ve barely scraped the surface of what Kibana or the other tools are capable of, but hopefully it shows you how you can rapidly dig in to your data to get the story behind something that happened, and see it in a way that doesn’t need Cypher to tell you which symbols are the blondes, brunettes and redheads.