Category Archives: Log Analysis

tstats: afterburners for your Splunk threat hunting

Recently, @da_667 posted an excellent introduction to threat hunting in Splunk. The information in Sysmon EID 1 and Windows EID 4688 process execution events is invaluable for this task. Depending on your environment, however, you might find these searches frustratingly slow, especially if you are trying to look at a large time window. You may also have noticed that although these logs concern the same underlying event, you are using two different searches to find the same thing. Is there anything we can do to improve our searches? Spoiler: yes!

One of the biggest advantages Splunk grants is in the way it turns the traditional model of indexing SIEM events on its head. Instead of parsing all the fields from every event as they arrive for insertion into a behemoth of a SQL database, they decided it was far more efficient to just sort them by the originating host, source type, and time, and extract everything else on the fly when you search. It’s a superb model, but does come with some drawbacks.

Some searches that might have been fast in a database are not so rapid here. Again, because there is no database, you are not constrained to predefined fields set by the SIEM vendor – but there is nothing to keep fields with similar data having the same name, so every type of data has its own naming conventions. Putting together a search that covers three different sources for similar data can mean having to know three different field names, event codes specific to the products… it can get to be quite a hassle!

The answer to these problems is datamodels, and in particular, Splunk’s Common Information Model (CIM). Datamodels allow you to define a schema to address similar events across diverse sources. For example, instead of searching

index=wineventlog EventCode=4688 New_Process_Name="*powershell.exe" 

and

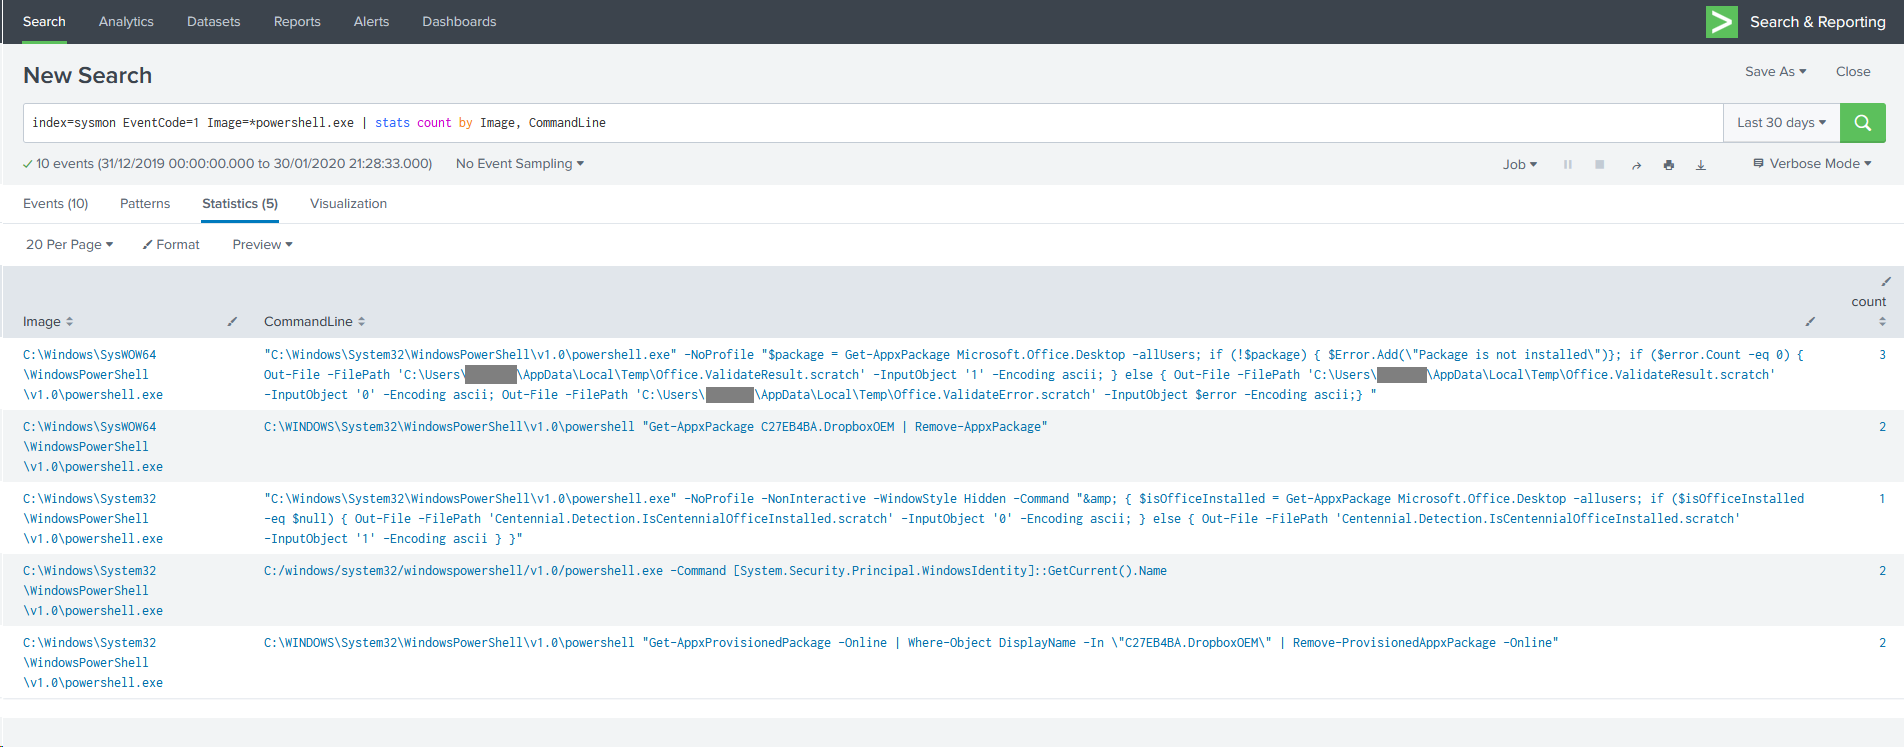
index=sysmon EventCode=1 Image=*powershell.exe 

separately, you can search the Endpoint.Processes datamodel for process_name=powershell.exe and get results for both. The CIM is a set of predefined datamodels for, as the name implies, types of information that are common. Once you have defined a datamodel and mapped a sourcetype to it, you can “accelerate” it, which generates indexes of the fields in the model. This process carries a storage, CPU and RAM cost and is not on by default, so you need to understand the implications before enabling it.

Turn it up to 11

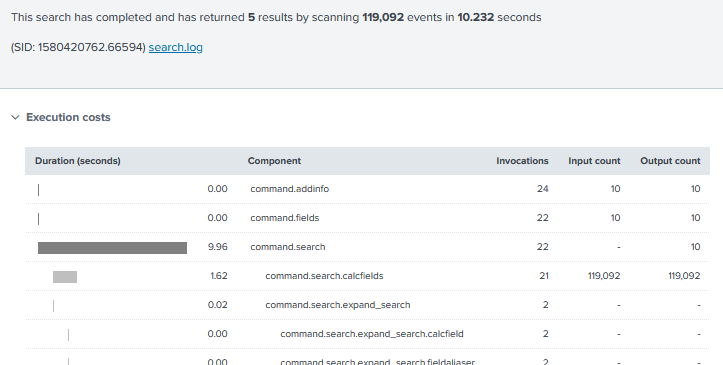
Let’s take this example, based on the fourth search in @da_667’s blog. In my (very limited) data set, according to the Job Inspector, it took 10.232 seconds to search 30 days’ worth of data. That’s not so bad, but I only have a few thousand events here, and you might be searching millions, or tens of millions – or more!

Splunk Job Inspector showing search time and cost breakdown

What happens if we try searching an accelerated datamodel instead? Is there much of a difference?

Splunk Job Inspector information for accelerated datamodel search

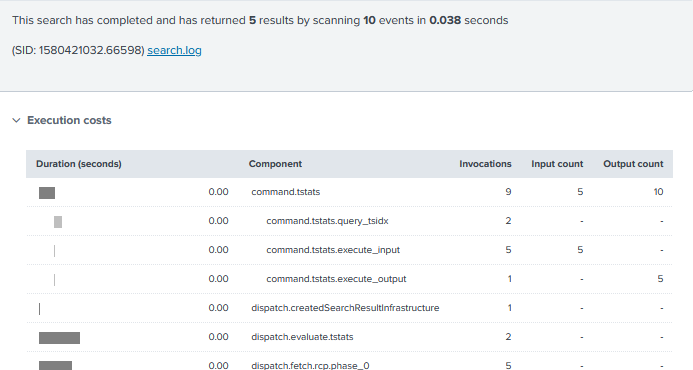
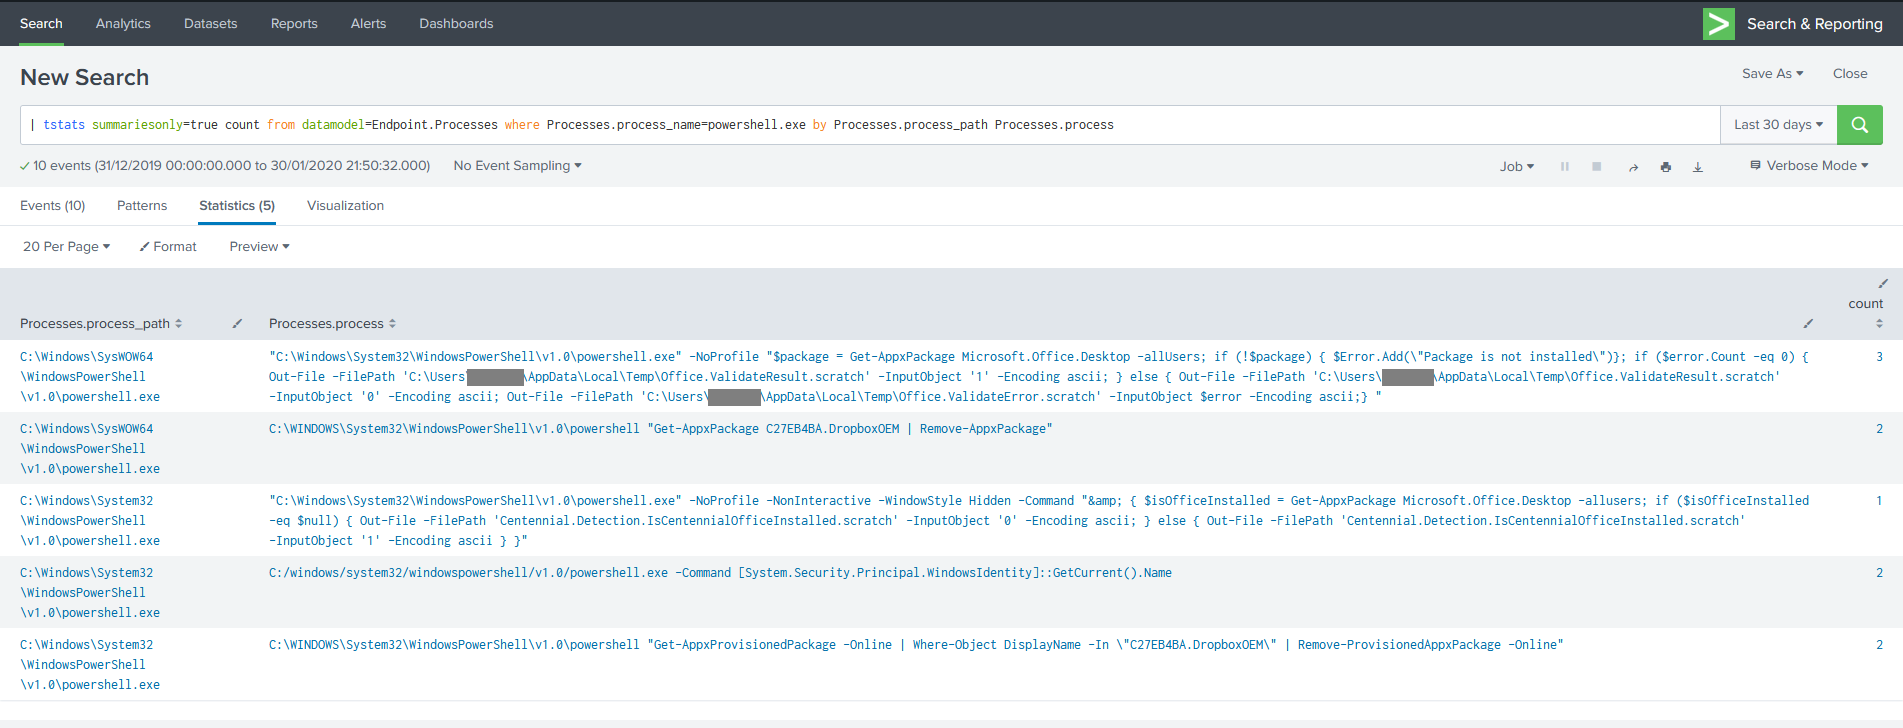
Holy shitballs yes it does. This search returned in 0.038 seconds, that’s nearly 270x faster! What sorcery is this? Well, the command used was:

| tstats summariesonly=true count from datamodel=Endpoint.Processes where Processes.process_name=powershell.exe by Processes.process_path Processes.process

What’s going on in this command? First of all, instead of going to a Splunk index and running all events that match the time range through filters to find “*.powershell.exe“, my tstats command is telling it to search just the tsidx files – the accelerated indexes mentioned earlier – related to the Endpoint datamodel. Part of the indexing operation has broken out the process name in to a separate field, so we can search for an explicit name rather than wildcarding the path.

The statistics argument count and the by clause work similarly to the traditional stats command, but you will note that the search specifies Processes.process_name – a quirk of the structure of data models means that where you are searching a subset of a datamodel (a dataset in Splunk parlance), you need to specify your search in the form

datamodel=DatamodelName[.DatasetName] where [DatasetName.]field_name=somevalue by [DatasetName.]field2_name [DatasetName.]field3_name

The DatasetName components are not always needed – it depends whether you’re searching fields that are part of the root datamodel or not (it took me ages to get the hang of this so please don’t feel stupid if you’re struggling with it).

Filtered, like my coffee

Just as with the Hurricane Labs blog, options for filtering and manipulating tstats output can be managed with the same operations.

| tstats summariesonly=true count from datamodel=Endpoint.Processes where Processes.process_name=powershell.exe NOT Processes.parent_process_name IN ("code.exe", "officeclicktorun.exe") by Processes.process_path Processes.process | `drop_dm_object_name("Processes")`

You can filter on any of the fields present in the data model, and also by time, and the original index and sourcetype. The resulting data can be piped to whatever other manipulation/visualisation commands you want, which is particularly handy for charts and other dashboard features – your dashboards will be vastly sped up if you can base them on tstats searches.

You’ll also note the macro drop_dm_object_name – this reformats the field names to exclude the Processes prefix, which is handy when you want to manipulate the data further as it makes the field names simpler to reference.

A need for speed

How do I get me some of this sweet, sweet acceleration I hear you ask? The first thing to understand is that it needs to be done carefully. You will see an increase in CPU and I/O on your indexers and search heads. This is because the method involves the search head running background searches that populate the index. There will be a noticeable increase in storage use, with the amount depending on the summary range (i.e. time period covered by detailed indexing) and how busy your data sources are.

With this in mind, you can start looking at the Common Information Model app and the documentation on accelerating data models. I highly recommend consulting Splunk’s Professional Services before forging ahead, unless your admins are particularly experienced. The basic process is as follows:

  • Ensure that your sourcetypes are CIM compliant. For most Splunk-supported apps, this is already done.
  • Ensure that you have sufficient resources to handle the increased load
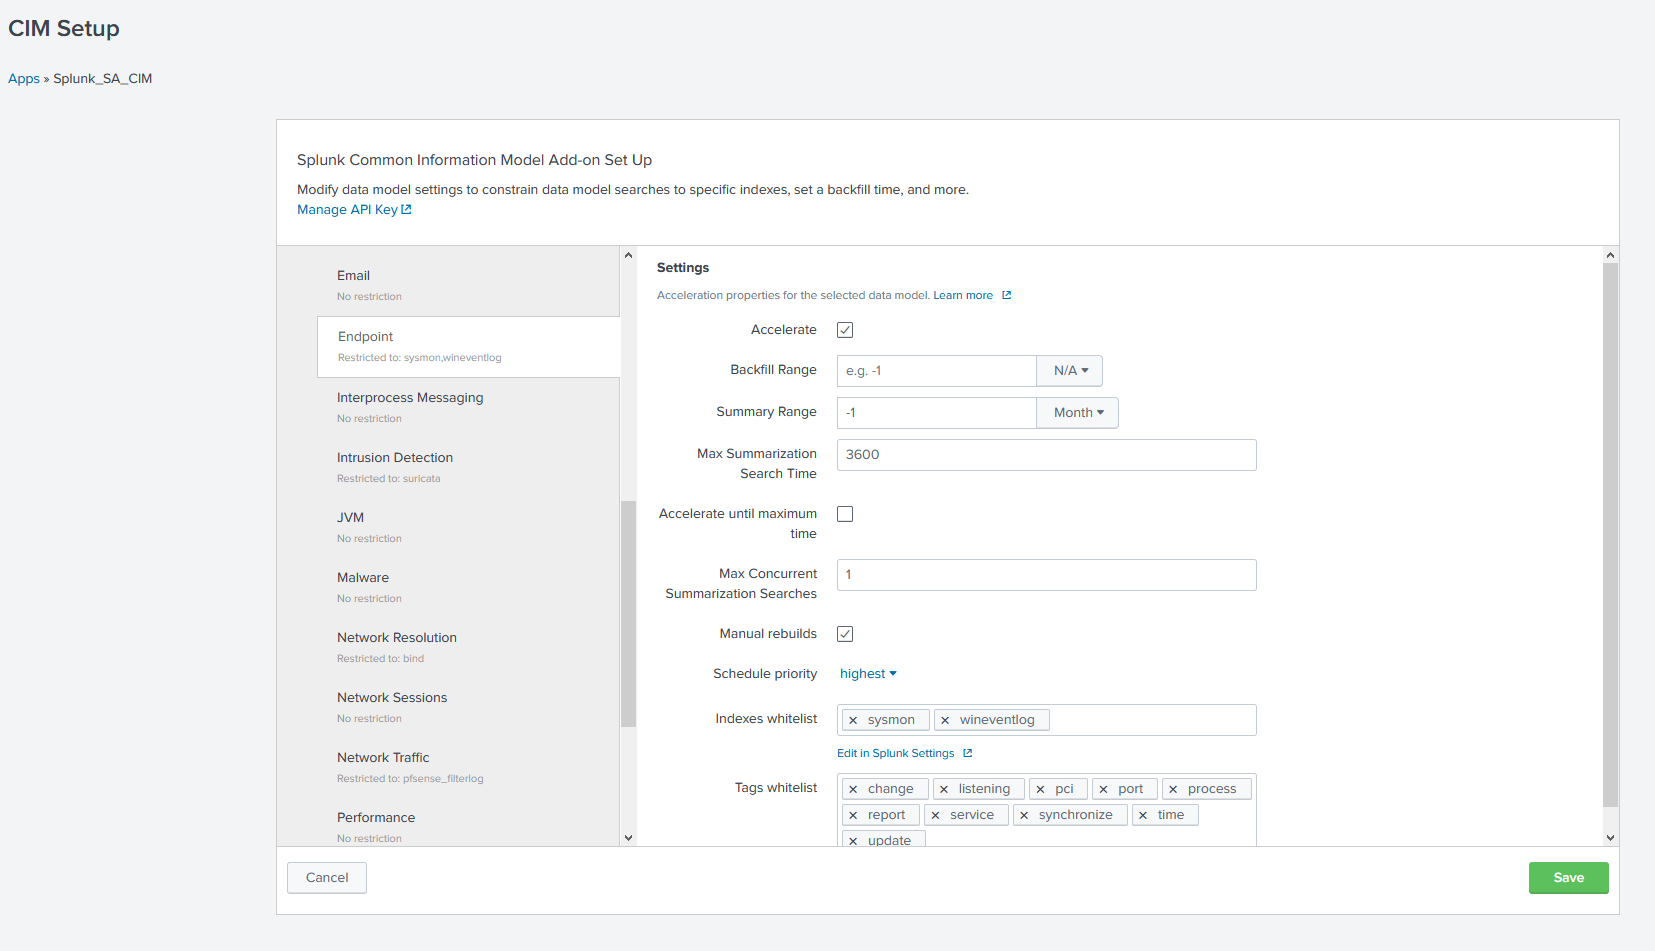
  • Deploy the CIM app
  • Enable acceleration for the desired datamodels, and specify the indexes to be included (blank = all indexes. Inefficient – do not do this)
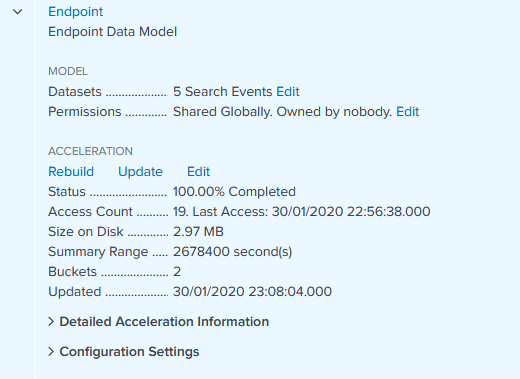
  • Wait for the summary indexes to build – you can view progress in Settings > Data models
  • Start your glorious tstats journey
Configuration for Endpoint datamodel in Splunk CIM app
Detail from Settings > Data models

Datamodels are hugely powerful and if you skim through the documentation you will see they can be applied to far more than just process execution. You can gather all of your IDS platforms under one roof, no matter the vendor. Get email logs from both Exchange and another platform? No problem! One search for all your email! One search for all your proxy logs, inbound and outbound! Endless possibilities are yours.

One search to rule them all, one search to find them… happy Splunking!

Collecting Netscaler web logs

A little while ago I wrote about collecting AppFlow output from a Citrix Netscaler and turning it into Apache-style access logs. Whilst that might technically work, there are a few drawbacks – first and foremost that Logstash gobbles CPU cycles like nobody’s business.

Furthermore, since the Netscaler outputs separate AppFlow records for request and response, if you want a normal reverse proxy log, you need to put them back together yourself. Although I have already described how to achieve that, as you can see above it is also not terribly efficient. So, is there a better way? There certainly is!

NetScaler Web Log Client

In order to deliver responses to requests correctly, the Netscaler must track the state of connections internally. Instead of creating our own Frankenstein’s Monster of a state machine to reassemble request and response from AppFlow, it would be much simpler if we could get everything from a place that already has the combined state. The good news is that Citrix have provided a client application to do just that. The bad news is that their documentation is a little on the shonky side, and it isn’t always clear what they mean. To fill in some of the gaps, I have written a brief guide to getting it running on CentOS 7. I will assume for this that you have installed CentOS 7 Minimal and updated it through yum.

Obtain the client

Citrix’s description of where to find the client on their site isn’t terribly helpful. Here’s how to get there at the time of writing:

    Citrix Portal > Downloads > Citrix Netscaler ADC > Firmware > [your version] > Weblog Clients

Prep the Netscaler

Ensure Web logging is turned on

    System > Settings > Configure Advanced Features > Web Logging

Ensure remote authentication is OFF for the nsroot user (not expecting many people to encounter this problem but it’s not easy to troubleshoot – the client just shows an authentication failure even if you entered the password correctly)

    System > User Administration > Users > nsroot > Enable External Authentication

Install and configure the NSWL client

Extract the .rpm from the zip downloaded from the Citrix portal and transfer it to your CentOS system. Run the following commands as root:

    $> yum install glibc.i686
    $> rpm -i nswl_linux-[citrix_version].rpm

You need to be able to connect from the system you are running the client on to your Netscaler reverse proxy on port 3011.

    $> nc -v [netscaler_ip] 3011

Add the target IP and nsroot account credentials to the config file as described in the Citrix docs (yes, some of their instructions are accurate – just not everything):

    $> /usr/local/netscaler/bin/nswl -addns -f /usr/local/netscaler/etc/log.conf

Edit the config file to set the format, log output directory, rotation settings etc.

----extract from /usr/local/netscaler/etc/log.conf----
logFormat    NCSA %h %v %l %u %p [%t] "%r" %s %j %J %{ms}T "%{referer}i" "%{user-agent}i"
logInterval			Daily
logFileSizeLimit		1024
logFilenameFormat		/var/log/netscaler/nswl-%{%y%m%d}t.log
------------------------------------------------------

Note: Citrix do not appear to provide a complete breakdown of what format strings are accepted, so I used the Apache documentation as a reference. However, not all of the variables are supported by the NSWL client, and some work in a different manner than expected. For example, %D does not output microseconds, but the %{UNIT}T style does work.

Configure a service to run the NSWL client

    $> vim /etc/systemd/system/nswl.service

[Unit]
Description=nswl

[Service]
Type=simple
User=nswl
Group=nswl
ExecStart=/usr/local/netscaler/bin/nswl -start -f /usr/local/netscaler/etc/log.conf	

[Install]
WantedBy=multi-user.target

    $> useradd -d <log directory> -s /sbin/nologin nswl
    $> chown -R nswl:nswl <log directory>
    $> systemctl daemon-reload
    $> service nswl start

SIEM configuration and log rotation

The logFormat directive shown above is similar to the standard Apache Combined format, but not identical. To parse the output, a slightly tweaked version of the regex is necessary:

^(?<src_ip>\S+) (?<site>\S+) (?:-|(?<ident>\S+)) (?:-|(?<user>\S+)) (?<dest_port>\d+) \[[^\]]*] "(?<request>[^"]+)" (?<status>\d+) (?<request_bytes>\d+) (?<response_bytes>\d+) (?<response_time>\d+) "(?:-|(?<http_referer>[^"]*))" "(?:-|(?<http_user_agent>.*))"

You should use a prefix pattern to match files to collect – do NOT use a suffix pattern like ‘*.<extension>‘ to track files. The NSWL client creates a new file with ‘.<number>‘ appended under many circumstances, including when the service is restarted, when the logFileSizeLimit is reached, and others. For example, if the service was restarted while writing to ‘nswl-20191001.log‘, it would begin writing ‘nswl-20191001.log.0‘.

Make sure to take this into account when configuring log rotation – e.g. move the files before compressing: ‘$> gzip nswl-20191001.log‘ results in ‘nswl-20191001.log.gz‘, which matches the pattern ‘nswl-*‘; SIEM agents may consider the latter file to be new and index it again, resulting in duplicate data.

Results

Using 1% CPU and a single process as opposed to the previous method of attempting to melt a CPU into the motherboard substrate is a definite improvement. Another plus is that it’s an officially supported tool, so in theory if something’s not working you can actually get some help with it.

I’m pretty proud of my eldritch horror of a python script, it ran for nearly two years in production with no significant problems (unlike Logstash which needed CPR every 6 weeks or so), but it’s high time my code was retired.

BSides Workshop “My log obeys commands – Parse!”

Better late than never, as they say. Last week I went to BSides London, which was pretty awesome. In between hanging out with all sorts of awesome people and downing mojitos, I had the opportunity to present a workshop. It seemed to go pretty well – though I have definitely learned enough to improve it for next time.

The short version is that it was an introduction to the basic principles and techniques of log parsing, for people at the level of a junior SOC analyst. Minimal regex knowledge required.

Although I don’t have a recording of the workshop, I’m putting the slides up here in case they’re of use to anyone. Enjoy! If you have any questions, please tweet @http_error_418 😊

My log obeys commands – Parse!

Collecting Netscaler appflow reverse proxy logs

TL/DR: python script to combine Netscaler reverse proxy HTTP request and response objects and output the result as an Apache-style log. Github repo is here: https://github.com/scherma/ipfixwatch

So the time came where your organisation decided it needs a new and shiny reverse proxy, hopefully before the current bucket of bolts went to the great big datacentre in the sky. It’ll be fun, they said. I told them we needed to talk about the definition of fun. They said they’d schedule a meeting.

This is not the right place to provide (nor am I really qualified) to give an in depth explanation of appflow; the short version is that it is a binary protocol for logging application-level information in a form that is more flexible than syslog. It has the benefit of having a well-defined structure, which is a plus from a log collection perspective, but being binary means parsing it is tricky and requires specialised tools.

So how can you get the juicy details out of that content? Easier said than done. Citrix will happily sell you an appliance; I leave it to the reader to imagine how many arms and legs the price might be. Ditto Splunk. Then there are the free/OSS options, which is where we arrive at Logstash.

Logstash can receive appflow (or ipfix/netflow) data, parse it, and output information summarising each appflow record. This is great and works (mostly). But when one starts looking at the output, a fly appears in the ointment: requests and responses are logged in separate records. This means that if you’re looking to replace your existing logs like for like, you could have a problem on your hands. Let’s take a look at some of the data. Here is the output in Logstash’s standard json format for a HTTP request:

{
    "@version":"1",
    "host":"10.0.50.4",
    "netflow":{
        "destinationIPv4Address":"10.0.50.5",
        "netscalerHttpReqUserAgent":"Mozilla/5.0",
        "destinationTransportPort":443,
        "netscalerHttpReqUrl":"/some/random/path?with=parameters&other=stuff",
        "sourceIPv4Address":"123.234.123.234",
        "netscalerHttpReqMethod":"GET",
        "netscalerHttpReqHost":"internalhost.unsafehex.com",
        "netscalerHttpReqReferer":"",
        "sourceTransportPort":1337,
        "netscalerHttpDomainName":"netscalerdemo.unsafehex.com",
        "netscalerTransactionId":2459675,
        "netscalerHttpReqXForwardedFor":""
    },
    "@timestamp":"2017-11-08T14:59:58.000Z",
    "type":"ipfix"
}

Plenty of useful information, but as you can see, nothing to indicate what response this request got. This is because the raw appflow packets from the Netscaler output the request and response as separate records, and Logstash is doing a literal translation of each binary record into a separate JSON object. Now let’s have a look at the corresponding response record:

{
    "@version":"1",
    "host":"10.0.50.4",
    "netflow":{
        "destinationIPv4Address":"123.234.123.234",
        "destinationTransportPort":1337,
        "sourceIPv4Address":"10.0.50.5",
        "netscalerHttpRspStatus":200,
        "sourceTransportPort":443,
        "netscalerHttpRspLen":35721,
        "netscalerTransactionId":2459675
    },
    "@timestamp":"2017-11-08T14:59:59.000Z",
    "type":"ipfix"
}

Fortunately for us, although it does not provide us the request and response in a single record, it does mark them as belonging to the same transaction, via the netscalerTransactionId field. This means that we are now able to combine the information and produce the information you might be expecting in an HTTP log.

Having discovered this this, I was able to throw together a python script which will read the JSON output of Logstash and rebuild the separate records into a unified message. At the time the Apache Extended format was the most suited for my requirements and so the current version of my script (here) writes this out to hourly log files. Given that the data becomes a python dict, it would be very easy to adapt this to whatever other format you are interested in.

The code’s clearly a hack job so if anyone feels like turning it into good code, I’d welcome the education. In any case, happy parsing!

A few notes:

  • ipfix, and hence appflow, are UDP protocols. There is no guarantee that Logstash will capture the corresponding response for every request, or vice versa. The script maintains a dict of currently-unmatched requests and responses for which there is a size limit to prevent it eating all of your memory. While Logstash is operating normally I have not seen any issues with unpaired request/response but it is theoretically possible.
  • If the script cannot match a request with a response, it will stay in memory until the script is stopped with SIGINT or keyboard interrupt, or the table size limit is reached. At this point, unpaired requests will be written to the output with a response code of 418. Unpaired responses will be discarded.
  • It won’t auto-create the output directory at this point. Sorry, forgot that part, I made them manually and didn’t think of it.

syslog-ng flat file collection: where did my program go?!

Using syslog-ng to forward logs is pretty nice, there’s plenty of documentation and the configuration is relatively easy to understand compared to other stuff out there (looking at you rsyslog), but that doesn’t mean everything is completely obvious. If you search for information on how to read a text file log with syslog-ng, you might come up with something like this:

source s_squid3access {
    file("/var/log/squid3/access.log" follow-freq(1)); };

Which checks the file /var/log/squid3/access.log for new entries every second. However, if you simply send this as is, you might end up with a message similar to the one below being sent to your syslog destination (note that I’ve modified my squid instance to log in the Apache Combined log format)

<13>1 2017-11-07T19:07:44+00:00 myproxy 192.168.1.4 - - [meta sequenceId="84"] - - [07/Nov/2017:19:07:43 +0000] "CONNECT www.netflix.com:443 HTTP/1.1" 200 12237 "-" "Mozilla/5.0 (Windows NT 10.0; Win64; x64) AppleWebKit/537.36 (KHTML, like Gecko) Chrome/62.0.3202.75 Safari/537.36" TCP_MISS:HIER_DIRECT

which corresponds to the following line in the log file:

192.168.1.4 - - [07/Nov/2017:19:09:03 +0000] "CONNECT www.netflix.com:443 HTTP/1.1" 200 5101 "-" "Mozilla/5.0 (Windows NT 10.0; Win64; x64) AppleWebKit/537.36 (KHTML, like Gecko) Chrome/62.0.3202.75 Safari/537.36" TCP_MISS:HIER_DIRECT

Note the position of the IP address in the syslog message – it is in the syslog header section in the position of the syslog program field. If you want to collect and parse this information in a SIEM for example, this will cause you quite the headache, as the message it attempts to interpret will begin “– – [07/Nov/2017:19:07:43 +0000]” rather than “192.168.1.4 – – [07/Nov/2017:19:07:43 +0000]“. It will no longer match the format of the data the collector is expecting (probably resulting in the message not getting parsed at all), and even if you tried fixing that, the missing data is a fairly crucial bit of info – there’s not much use knowing that someone visited a site if you can’t find out which user or host it was.

The answer is given in the syslog-ng documentation, although it is not immediately obvious. The section on collecting messages from text files hints that if the message does not have a syslog header, it may behave in an unusual way, but it does not explain in detail what will happen; for that you must look at the options for the file() method. In the description of the flags() option “no-parse” it notes that by default, syslog-ng assumes the first value in a log line is the syslog program. If you set this flag, your originating IP will again be part of the message section, and your SIEM/parsing will be happy again.

You can also set the program_override() option so that the program field is populated, as it is useful in certian SIEM/collection tools to have this info. Now your config file might look a bit like this:

source s_squid3access {
    file("/var/log/squid3/access.log" follow-freq(1) flags(no-parse) program_override("squid3")); };

and all should be well. Happy logging!

ELK and Plex’s DNS barf

Recently I’ve been playing around with ELK – Elasticsearch, Logstash and Kibana, a set of tools for collecting, indexing, searching and representing data. It’s particularly good for handling logs, and if there’s anything I am all about, it’s logs. It’s pretty fun, and once you get over the initial terminology hurdles, surprisingly easy (at least, for my modest home lab’s requirements). I don’t expect to be writing a guide about how to set it up since there are plenty of decent ones out there already, but thought people might like a nice little example of the kind of thing you can do once it’s running.

One thing that it can do very readily is flag up unusual events on your network – providing you are collecting the relevant logs of course. For instance, so far I have it receiving logs from all of my *nix boxes, firewall, IDS and VPN. I would give it proxy logs too, if I could persuade squid not to keep breaking everything, but that’s another story. Anyway, in passing I noticed that the number of events received had spiked massively over a one hour period last night.

Logspike

Well that got my attention! I figured it was probably something to do with the fact that I had been migrating my media server, but was a little surprised to see just how big a jump it was. Fortunately one thing that Elasticsearch (the index/log storage backend) and Kibana (the shiny web interface and visualisation tool) make absurdly easy is turning a big number like this into something readily understandable.

First I needed to understand how the logs in this time period were different from the rest of the day which as you can see has a pretty constant level of about 8,000 events per hour. This is as simple as adding what Kibana terms a ‘sub_bucket’, which allows you to split the count up based on various criteria. In my case I can selected one of the fields that I have indexed, to show how much of that volume is coming from which program.

Logspike breakdown

From this I see that the traffic through the firewall (filterlog) has jumped by two or three times – somewhat interesting, but the real eye-opener is that nice mauve colour. That would be bind, my DNS service, and quick back-of-envelope maths says that’s a 20-fold increase. What’s the deal, yo?

Yet again, you can make this nice and obvious with Kibana. If I filter down to just the logs coming from bind, I can then start breaking it down by one of the fields I’m extracting from the bind logs, the queried hostname.

Analyzed

And here we have two runaway culprits, lyricfind.plex.tv and lastfm-z.plexapp.com. That would be because when I stood up a new Plex server I hadn’t moved my old library data over. Plex therefore decided it needed to look up every item in my library, with DNS queries going out for each file.

This is a very small example and I’ve barely scraped the surface of what Kibana or the other tools are capable of, but hopefully it shows you how you can rapidly dig in to your data to get the story behind something that happened, and see it in a way that doesn’t need Cypher to tell you which symbols are the blondes, brunettes and redheads.