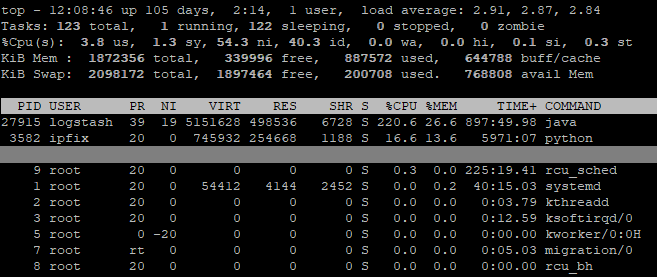
A little while ago I wrote about collecting AppFlow output from a Citrix Netscaler and turning it into Apache-style access logs. Whilst that might technically work, there are a few drawbacks – first and foremost that Logstash gobbles CPU cycles like nobody’s business.
Furthermore, since the Netscaler outputs separate AppFlow records for request and response, if you want a normal reverse proxy log, you need to put them back together yourself. Although I have already described how to achieve that, as you can see above it is also not terribly efficient. So, is there a better way? There certainly is!
NetScaler Web Log Client
In order to deliver responses to requests correctly, the Netscaler must track the state of connections internally. Instead of creating our own Frankenstein’s Monster of a state machine to reassemble request and response from AppFlow, it would be much simpler if we could get everything from a place that already has the combined state. The good news is that Citrix have provided a client application to do just that. The bad news is that their documentation is a little on the shonky side, and it isn’t always clear what they mean. To fill in some of the gaps, I have written a brief guide to getting it running on CentOS 7. I will assume for this that you have installed CentOS 7 Minimal and updated it through yum.
Obtain the client
Citrix’s description of where to find the client on their site isn’t terribly helpful. Here’s how to get there at the time of writing:
Citrix Portal > Downloads > Citrix Netscaler ADC > Firmware > [your version] > Weblog Clients
Prep the Netscaler
Ensure Web logging is turned on
System > Settings > Configure Advanced Features > Web Logging
Ensure remote authentication is OFF for the nsroot user (not expecting many people to encounter this problem but it’s not easy to troubleshoot – the client just shows an authentication failure even if you entered the password correctly)
System > User Administration > Users > nsroot > Enable External Authentication
Install and configure the NSWL client
Extract the .rpm from the zip downloaded from the Citrix portal and transfer it to your CentOS system. Run the following commands as root:
$> yum install glibc.i686
$> rpm -i nswl_linux-[citrix_version].rpm
You need to be able to connect from the system you are running the client on to your Netscaler reverse proxy on port 3011.
$> nc -v [netscaler_ip] 3011
Add the target IP and nsroot account credentials to the config file as described in the Citrix docs (yes, some of their instructions are accurate – just not everything):
$> /usr/local/netscaler/bin/nswl -addns -f /usr/local/netscaler/etc/log.conf
Edit the config file to set the format, log output directory, rotation settings etc.
----extract from /usr/local/netscaler/etc/log.conf----
logFormat    NCSA %h %v %l %u %p [%t] "%r" %s %j %J %{ms}T "%{referer}i" "%{user-agent}i"
logInterval			Daily
logFileSizeLimit		1024
logFilenameFormat		/var/log/netscaler/nswl-%{%y%m%d}t.log
------------------------------------------------------
Note: Citrix do not appear to provide a complete breakdown of what format strings are accepted, so I used the Apache documentation as a reference. However, not all of the variables are supported by the NSWL client, and some work in a different manner than expected. For example, %D does not output microseconds, but the %{UNIT}T style does work.
Configure a service to run the NSWL client
$> vim /etc/systemd/system/nswl.service
[Unit]
Description=nswl

[Service]
Type=simple
User=nswl
Group=nswl
ExecStart=/usr/local/netscaler/bin/nswl -start -f /usr/local/netscaler/etc/log.conf

[Install]
WantedBy=multi-user.target
$> useradd -d <log directory> -s /sbin/nologin nswl
$> chown -R nswl:nswl <log directory>
$> systemctl daemon-reload
$> service nswl start
SIEM configuration and log rotation
The logFormat directive shown above is similar to the standard Apache Combined format, but not identical. To parse the output, a slightly tweaked version of the regex is necessary:
^(?<src_ip>\S+) (?<site>\S+) (?:-|(?<ident>\S+)) (?:-|(?<user>\S+)) (?<dest_port>\d+) \[[^\]]*] "(?<request>[^"]+)" (?<status>\d+) (?<request_bytes>\d+) (?<response_bytes>\d+) (?<response_time>\d+) "(?:-|(?<http_referer>[^"]*))" "(?:-|(?<http_user_agent>.*))"You should use a prefix pattern to match files to collect – do NOT use a suffix pattern like ‘*.<extension>‘ to track files. The NSWL client creates a new file with ‘.<number>‘ appended under many circumstances, including when the service is restarted, when the logFileSizeLimit is reached, and others. For example, if the service was restarted while writing to ‘nswl-20191001.log‘, it would begin writing ‘nswl-20191001.log.0‘.
Make sure to take this into account when configuring log rotation – e.g. move the files before compressing: ‘$> gzip nswl-20191001.log‘ results in ‘nswl-20191001.log.gz‘, which matches the pattern ‘nswl-*‘; SIEM agents may consider the latter file to be new and index it again, resulting in duplicate data.
Results
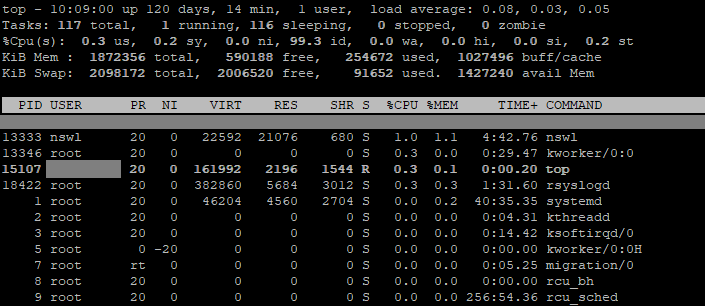
Using 1% CPU and a single process as opposed to the previous method of attempting to melt a CPU into the motherboard substrate is a definite improvement. Another plus is that it’s an officially supported tool, so in theory if something’s not working you can actually get some help with it.
I’m pretty proud of my eldritch horror of a python script, it ran for nearly two years in production with no significant problems (unlike Logstash which needed CPR every 6 weeks or so), but it’s high time my code was retired.
Except that NSWL have all sorts of issues with duplicating entries.