20,000 Leagues Under The Sand: part 3
Just as important to a sandbox as identifying actions the malware took on the host is observing its behaviour on the network. These days malware is almost guaranteed to have network activity; understanding how a sample is communicating is often all that is needed to tell you what the malware is.
When setting up a sandbox, careful thought needs to be given to your networking setup. Most malware is concerned only with reaching its command and control (C2) servers, but in the past year multiple malware families have seen lateral movement capabilities added, helped in no small part by the release of the EternalBlue SMB exploit. Under no circumstances should traffic from your sandbox VMs have unrestricted access to your network. Fortunately, most hypervisors’ default options make it simpler to do it safely than not – just be aware of the potential.
Additionally you should consider attribution and evasion; malware authors police the origins of connections and are known to blacklist the addresses of AV vendors, security researchers, and tor. If you would rather not have your IP on one of these lists you should think about how you can control the way malware traffic exits your network. Possibly the safest way is to route your traffic out through a consumer ISP that dynamically assigns IP addresses – so you might not need to do anything, as a large proportion of ISPs use this as their default. If you have static addressing and can’t afford a second line to your property, you might be able to set this up with a 4G router and data plan. At the minute, my sandbox is routing via tor as I do not have the option of a dynamic IP without spending more money, and I would prefer to risk some malware not functioning over advertising my IPs.
Whichever way you route your traffic, it is pretty simple to capture the output and perform intrusion detection when using qemu/Libvirt. In order to route traffic from VMs, it is necessary to create a virtual network interface.
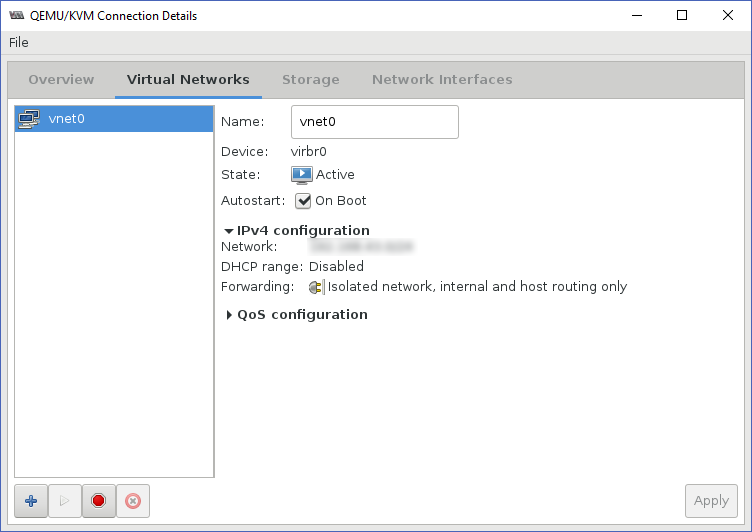
Libvirt network configuration
This interface will be added to your system’s available network interfaces and is valid for use with tcpdump, Suricata, etc. N.B. when listing IPs/interfaces with ‘ip addr’ you will see the virtual bridge interface and virtual network listed separately, and the IP/subnet you have assigned will be defined on the bridge interface (named virbr0 or similar). Be careful about your choice of which interface to capture on; there are potential pitfalls for each.
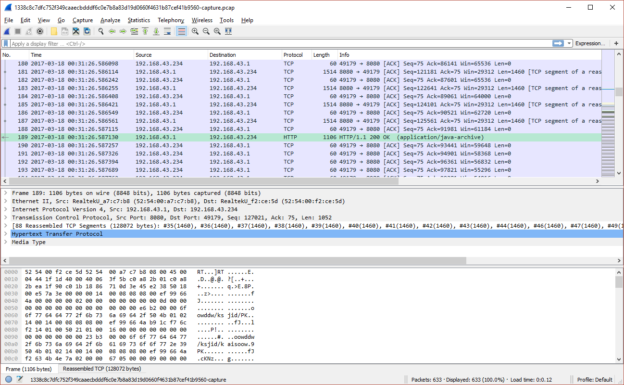
Firstly, the virtual bridge interface. When initially creating this post I encountered an issue with capturing at the virbr0 in which inbound packets for a TCP session had the correct source/destination IPs, but outbound packets showed the destination as being the gateway IP for the virtual network. As a result Suricata, Wireshark, and other tools could not reassemble the sessions correctly. I never identified precisely why this was so; unfortunately this means I cannot provide any specific advice for avoiding or fixing it other than to say it was probably related to the packet-rewriting rules being used to redirect traffic to tor.
I then switched to capturing on the virtual network, vnet0. This solved the problem of the inbound/outbound mismatches, however a capture (or Suricata inspection) on this interface will cease to function when there are no active attached hosts and will not start again unless the capture/IDS process is restarted. Thus if you are running a single VM as I have been and it reboots, your pcap and IDS processes will exit prematurely and will not resume when the VM does.
1: lo: <LOOPBACK,UP,LOWER_UP> mtu 65536 qdisc noqueue state UNKNOWN group default qlen 1
 link/loopback 00:00:00:00:00:00 brd 00:00:00:00:00:00
 inet 127.0.0.1/8 scope host lo
 valid_lft forever preferred_lft forever
 inet6 ::1/128 scope host
 valid_lft forever preferred_lft forever
2: ens192: <BROADCAST,MULTICAST,UP,LOWER_UP> mtu 1500 qdisc mq state UP group default qlen 1000
 link/ether 00:0c:29:3b:c7:47 brd ff:ff:ff:ff:ff:ff
 inet 10.0.0.4/24 brd 10.0.0.255 scope global ens192
 valid_lft forever preferred_lft forever
 inet6 fe80::20c:29ff:fe3b:c747/64 scope link
 valid_lft forever preferred_lft forever
3: virbr0: <BROADCAST,MULTICAST,UP,LOWER_UP> mtu 1500 qdisc noqueue state UP group default qlen 1000
 link/ether 52:54:00:ba:65:0e brd ff:ff:ff:ff:ff:ff
 inet 10.0.3.1/24 brd 10.0.3.255 scope global virbr0
 valid_lft forever preferred_lft forever
4: virbr0-nic: <BROADCAST,MULTICAST> mtu 1500 qdisc pfifo_fast master virbr0 state DOWN group default qlen 1000
 link/ether 52:54:00:ba:65:0e brd ff:ff:ff:ff:ff:ff
28: vnet0: <BROADCAST,MULTICAST,UP,LOWER_UP> mtu 1500 qdisc pfifo_fast master virbr0 state UNKNOWN group default qlen 1000
 link/ether fe:54:00:51:49:d6 brd ff:ff:ff:ff:ff:ff
 inet6 fe80::fc54:ff:fe51:49d6/64 scope link
 valid_lft forever preferred_lft forever

■ breaks when VM is shut down or restarted
■ may encounter issues with packet rewriting/tcp reassembly
Once the networking is set up, you can then deploy IDS to monitor it. There are two choices to consider, Snort and Suricata, and of these, the latter is so simple to get running that I’m largely mentioning the other to be charitable. Since versions and options change every few months I am not going to lay out a configuration; it would probably be obsolete by the time you read this. I will however highlight a couple of options in the current version (4.0.4 at the time of writing) of Suricata that deserve special mention.
eve-log: This is a catch-all log which can be configured to contain many different event types. Suricata can log metadata for many different protocols and situations including HTTP, DNS, TLS certificates, transferred files (e.g. HTTP downloads) including hashes, SMTP, and more. Almost all of this information is potentially useful in the context of a sandbox. While it is possible to spin off separate logs for each of these items, the JSON structure of the output makes it easy to parse and having them all together is convenient. Suricata supports rotating this log, naming according to a timestamp pattern, and setting custom permissions, all of which can be very handy.
rule-files: These are your detections, choose them wisely. The biggest bang for your buck is in the Emerging Threats community ruleset (free!), but not all of them will be applicable to a sandbox. You should consider disabling ones which are irrelevant; for example, ‘inappropriate’, ‘icmp’, ‘mobile_malware’, ‘games’, and ‘scada’ are unlikely to be applicable.
Similarly your packet capture should be done on the virtual network interface and not the bridge. For capturing packets there are a wealth of options, of which I have tried a number. Here are some of the highlights:
tcpdump: the obvious first choice as it’s what everyone’s used to, but for a permanent capture service, not the best one. Will output to a single specified file until cancelled and restarted with a different destination, meaning that the process of managing the output is entirely down to you.
scapy: this was my choice for a long time due to it being possible to control from within python. However, if you are running more than one sandbox VM and want simultaneous capture of traffic from multiple sources, this is not an efficient choice.
pyshark/tshark: another python library, and the underlying tool called by pyshark; the latter efficiently captures everything, and unlike TCPdump, has the ability to manage rotation of capture files itself.
dumpcap: the base utility underlying tshark’s packet capture. tshark is possibly overkill as it is capable of far more than simply capturing packets. This is the method I am using at the time of writing.
For example, an hourly cron script as follows should create 24 one-hour pcap files, overwritten each day:
HOUR=`date -u +'%H'`
dumpcap -i vnet0 -a duration:3600 -q -w /usr/local/unsafehex/antfarm/pcaps/$HOUR.pcap -f "<your filters here>"
Note the -u flag passed to date; when trying to make sense of events and logs, it is crucial to ensure that your time information lines up. The simplest way to do this is to log everything in UTC; if desired you can convert to local time when presenting the information to the user. Also, use the main crontab as cron.hourly entries don’t necessarily run on the hour mark and it is important for this concept that each file matches the hour span that it is named for.
As well as capturing the output and running IDS signatures against it, you may want to consider performing SSL interception. This is a complicated topic and I have not mastered it, so I will not attempt to offer complete instructions at this point. However I will give a few pointers based on what I know so far. The simplest means of performing SSL interception for you is likely to be the squid proxy and its ssl_bump feature. This can be done as an explicit proxy (you will need to configure your client) or as a transparent proxy. In either case you will need to install the certificate you have made into the client as a trusted root.
SSL intercept does not play nicely with tor. It may be possible to still get it working with some routing/iptables magic, but the normal choice for routing squid through tor of using priovxy as a parent will not work. Even if you do get your traffic routed through a proxy to tor, beware of DNS leakage. Using privoxy as the parent combats this; if you bypass this stage you will need to come up with a new solution for preventing DNS leak. I plan to integrate SSL intercept but only once I have the option of a dynamic IP.
There are other tools that you might consider using with your network traffic inspection, such as the metadata-logging framework Bro; however with recent updates, Suricata’s metadata capture is so powerful that it’s unlikely you’ll need anything else.
In the next post I discuss automating the delivery and execution of malware to the guest VM, and simulating user interaction.